Contents
What is Releasd?
The Control Panel
Adding Users
Using Brands
Creating a New Report
Using the Report Builder
Previewing a Report
Sharing Reports
Duplicating Reports
1. What is Releasd?
If you're here, you're probably looking to streamline your PR reporting process and prove the impact of your work.
To achieve this, Releasd makes it easy to:
Showcase all types of media coverage
Measure success with core KPIs and advanced analytics
Share supporting activities and narrative to add context
Create templates that can be quickly re-used
These step-by-step instructions will help you understand how Releasd works.
First, let's have a look at at some example Releasd reports for inspiration
Mandarin Oriental: Monthly PR & Social Report
Brother: Quarterly Trade & Consumer Report
Bauer Media: Campaign Report
Panasonic: Event Wrapup Report
Marriott International: Press Trip & PR Report
And in the below video, our CEO Richard discusses the key features of the platform:
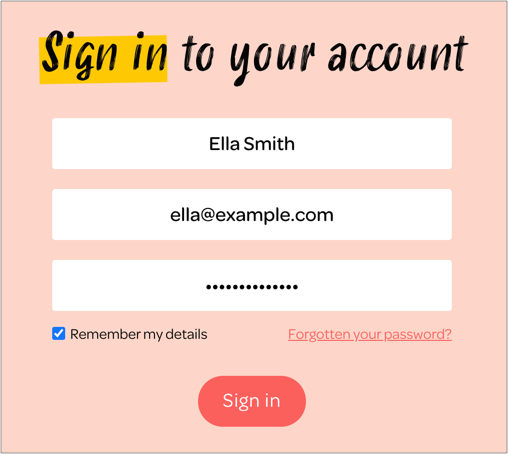
2. The Control Panel
Go to releasd.com/signin and enter your name, email and password.
Tip: If you haven’t got a Login yet, you’ll need to request one from your account Administrator.
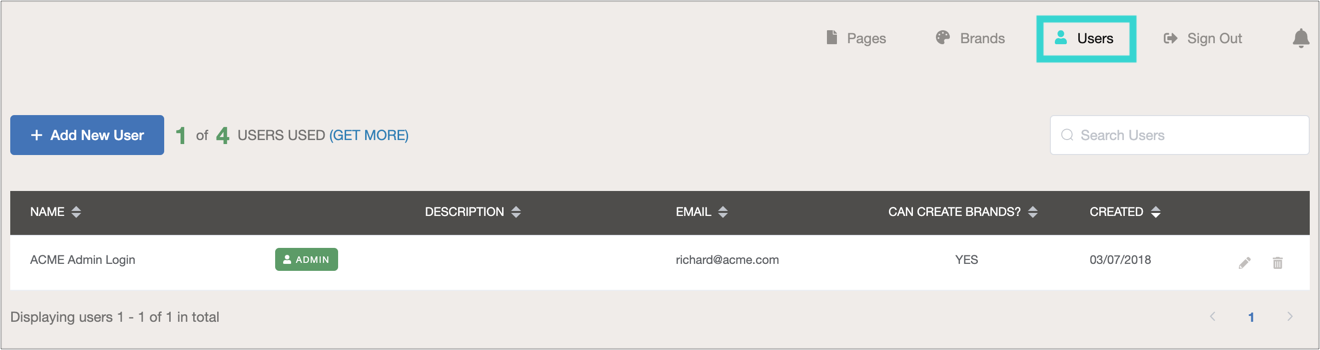
3. Adding Users
Anyone who needs to create or edit a Releasd report requires their own Login.
Logins are managed from the Control Panel > Users tab.
Just click 'Add a New User' to set access rights and invite your colleagues into the account.
Read our full guide to managing users here.
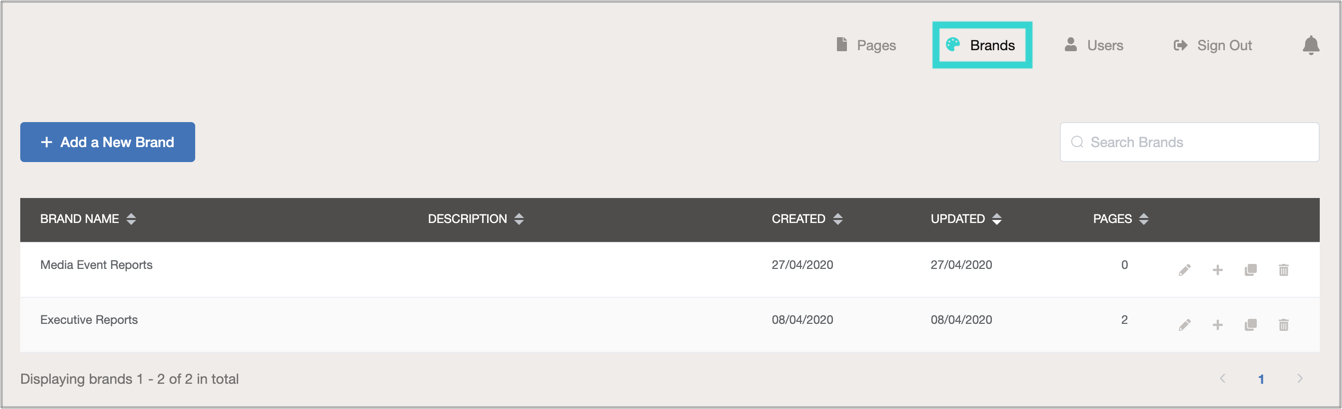
4. Using Brands
Create Brands for different clients, campaigns or corporate identities for example.
All reports under a Brand share the same:
Logo
Background image
Fonts
Colour scheme
1. Click on the Brands tab
Then click 'Add a New Brand'.
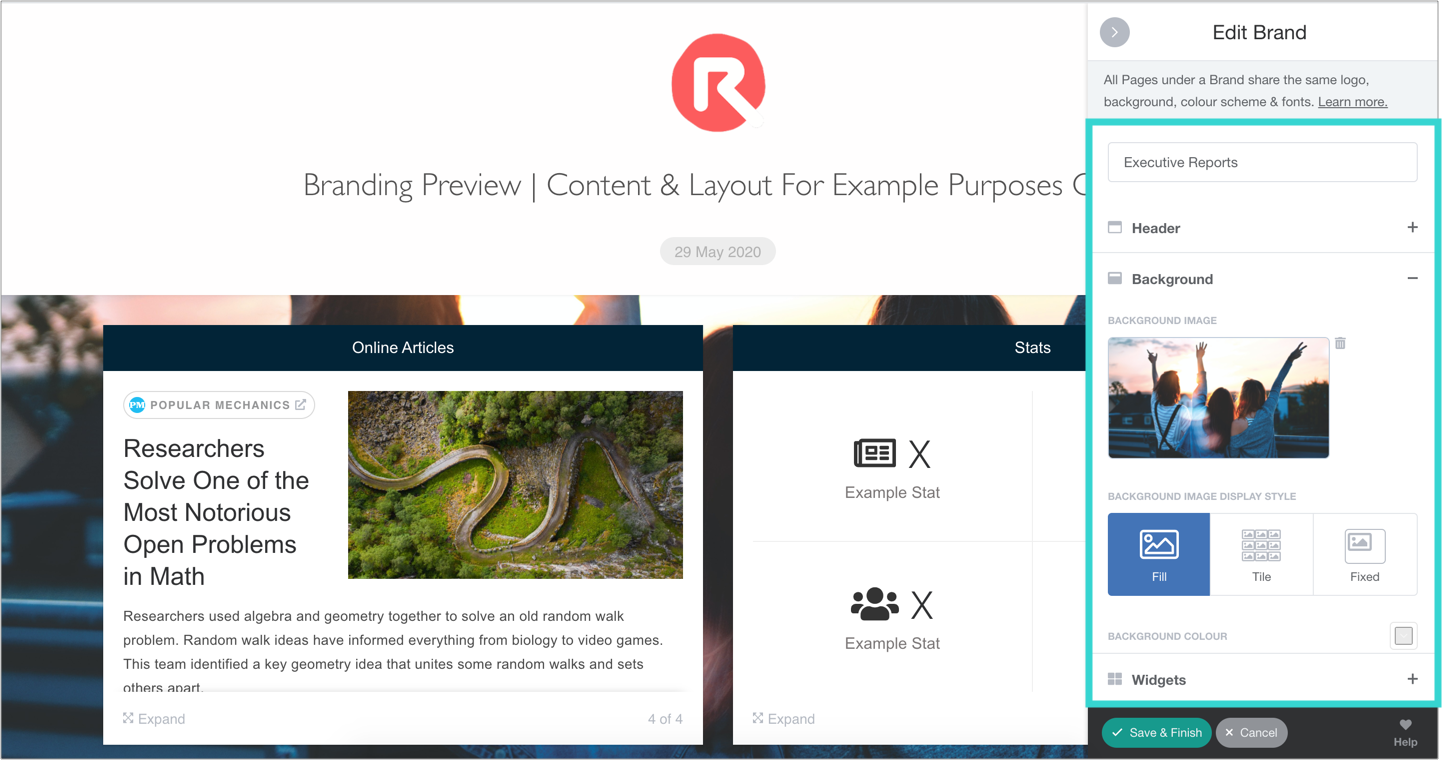
2. Add branding elements
After giving the Brand a name, explore the side-bar on the right of the screen to edit the header, background and widget settings.
Note: always add a background image - it'll make your reports much more visual and professional.
Read our full article about Brands.
5. Creating a New Report + The Templates Gallery
Now you've added a Brand, it's time to create your first report.
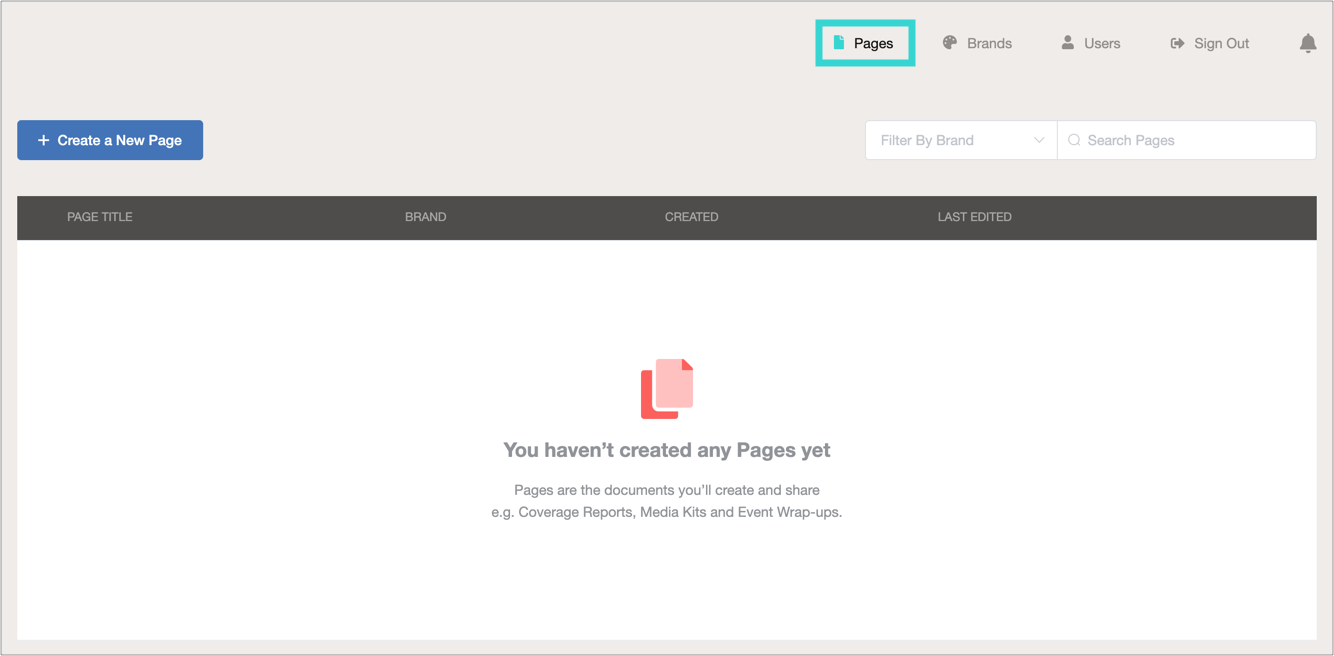
1. Click the Pages tab
Then 'Create a New Page'.
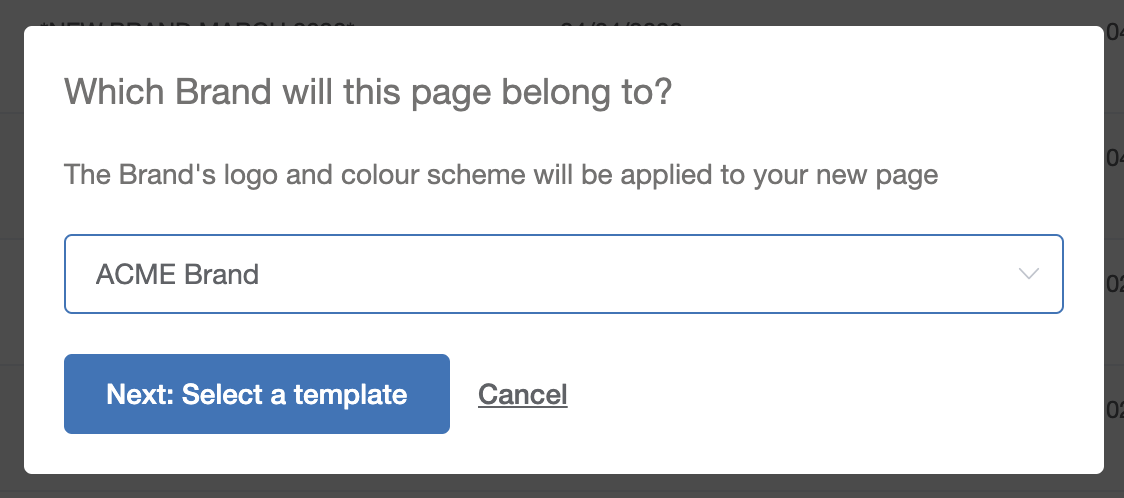
2. Pick a Brand
This will determine the look and feel of your report.
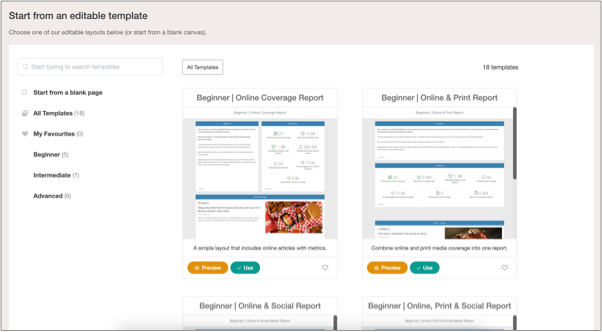
3. Start from an editable Template (recommended) or blank canvas
Select from a range of layouts; don't worry they can be edited to suit your needs in the Report Builder.
Read our guide to Report Templates here.
6. The Report Builder + Content Widgets
The Report Builder enables users to create highly customised reports by dragging, dropping and resizing.
See how it works below.
Widget Types
Click on the headers below to explore the different types of content that can be added to your reports.
Structural Elements
The Header and Spacer widgets can be used to create sections and dividers respectively.
Coverage
Paste URLs to quickly generate live snapshots of online articles with a raft of automated metrics.
Showcase live posts and metrics from platforms including YouTube, Instagram, LinkedIn, Facebook & X.
Upload scans in the form of PDFs or images to create galleries of print coverage.
Upload or paste links to broadcast clips to showcase TV coverage within a report.
Upload or paste links to audio clips to showcase radio and podcast coverage within a report.
Measurement
Create an infographic for granular and report-level metrics. Create custom KPIs.
Add powerful analytics that prove the value of your PR results:
Demonstrate that PR has raised brand awareness:
Mentions, Brand-Level Sentiment, Prominence
Attention Earned (Hours), Attention Cost Equivalence (£/$/€)
Prove that PR has impacted audiences:
Key Message Penetration, Spokesperson Quote Inclusion
Perception, Recall Score
And more
Content
Add copy, for example a summary of your PR activity.
Draw attention to comments from media influencers or event attendees.
Showcase product shots, event images or any other supporting imagery in a gallery.
Upload/embed broadcast coverage or promo content which can be played within the report.
Embed press releases, reports, coverage logs or any Word, PPT, PDF or Excel files.
Include links to other reports or any web page.
Add contact information, for example for the team who created the Page.
Embed content from third party platforms including audio, Google Maps or countdown clocks.
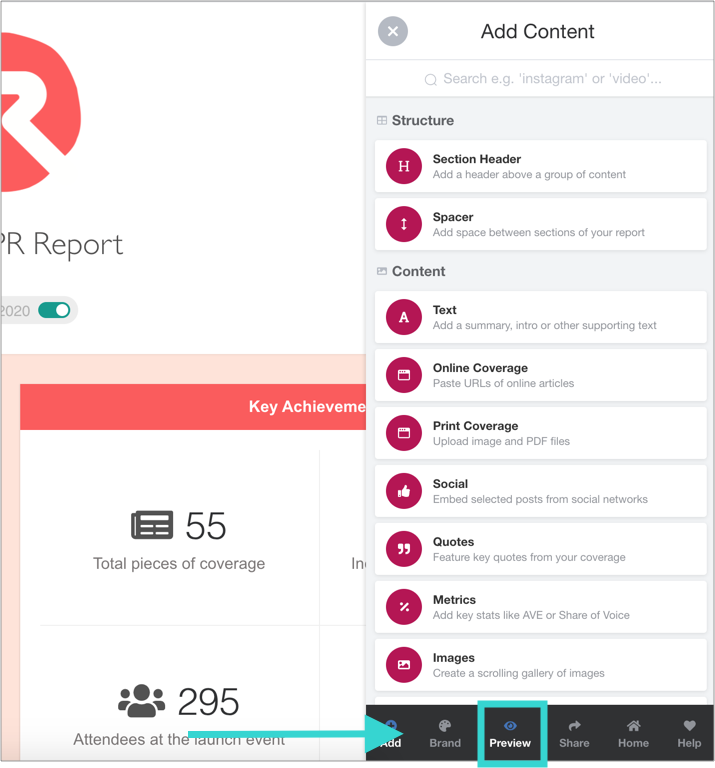
7. Previewing a Report
To see how your report will look to readers, click Preview in the Toolbar.
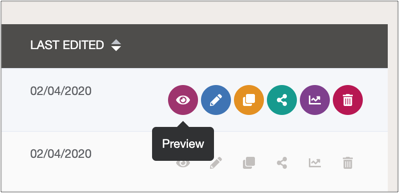
To preview a report from the Control Panel, select the Pages tab, the click Preview.
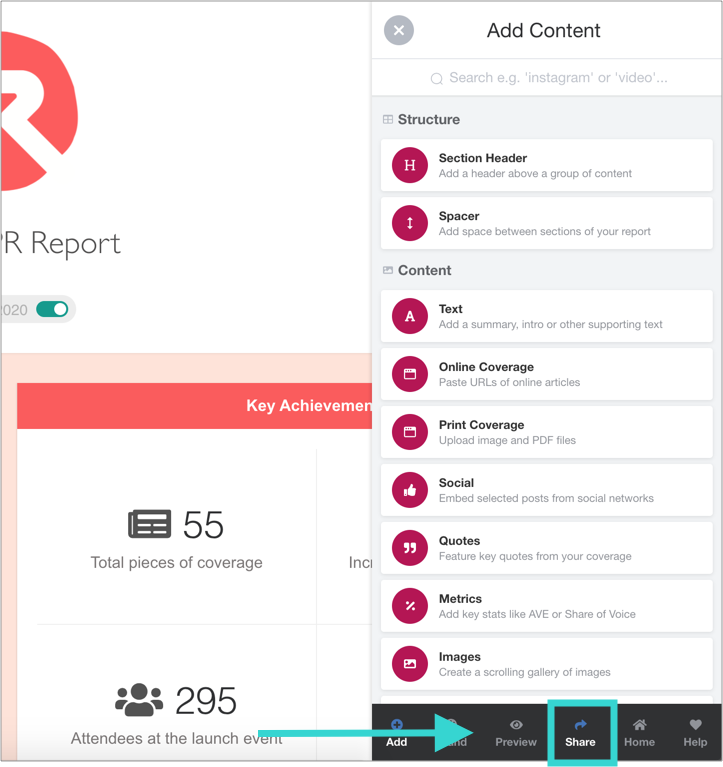
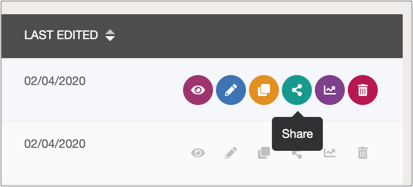
8. Sharing a Report
Reports can be shared via the Toolbar in the Builder.
Or go to the 'Pages' tab in the Control Panel.
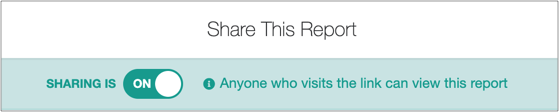
1. Put the report live
Before a report can be shared, it must be put live. Switch the Share slider on.
This will also refresh the metrics within the report, so it's best to leave this step until last.
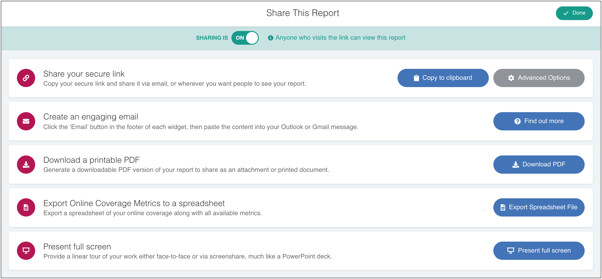
2. Select your method of sharing
Secure link: a live, interactive report that works perfectly on any device
PDF: a hard copy that can be downloaded and attached to an email
Editable PowerPoint: a fully editable presentation deck
Excel: a data-rich export that provides data on a granular level for online and social coverage
Full Screen Presentation: an interactive online version that's useful for presenting face-to-face or via Zoom
Read the full Sharing article here.
9. Saving Time by Duplicating an Existing Report
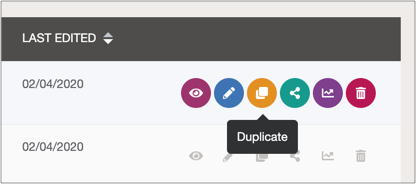
Once you've created a report that you're happy with, you can save time by duplicating it.
1. Go to the Pages tab, then click 'Duplicate'
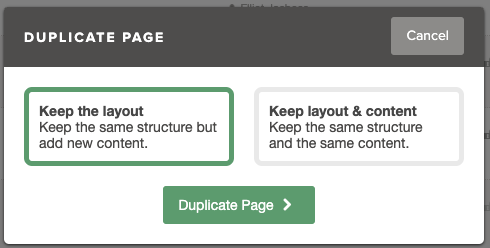
2. Decide whether to keep the original content, or just the structure
Keep the layout: This maintains the structure of the report, but strips out all of the content (e.g. coverage, stats etc). This is useful for monthly reports for example
Keep layout & content: This maintains both the structure and the original content. Useful if you want to tweak a report for different audiences, for example one for Execs, another for Sales
We hope you've found this guide useful. Have feedback or need help? Contact us at support@releasd.com or +44 (0) 20 3355 7459.