The Summary Metrics widget is used to display KPIs and supporting activities in a clear and visually engaging way.
See a list of all automated PR and social metrics.
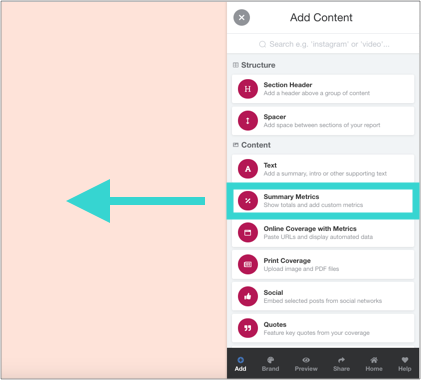
Adding the Summary Metrics Widget to a Report
Drag the Summary Metrics widget from the Toolbar onto the report:
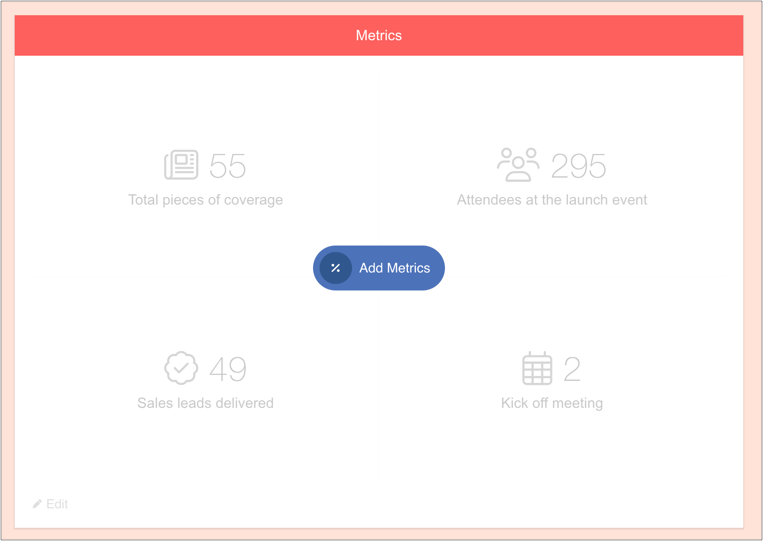
Then click 'Add Metrics':
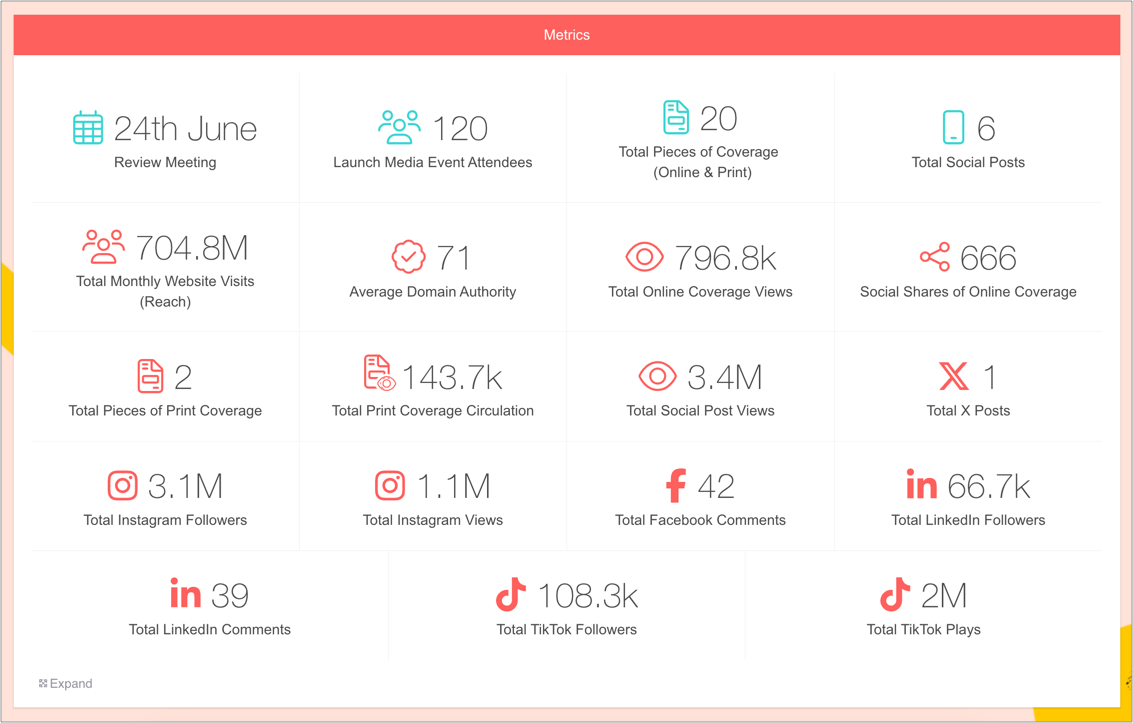
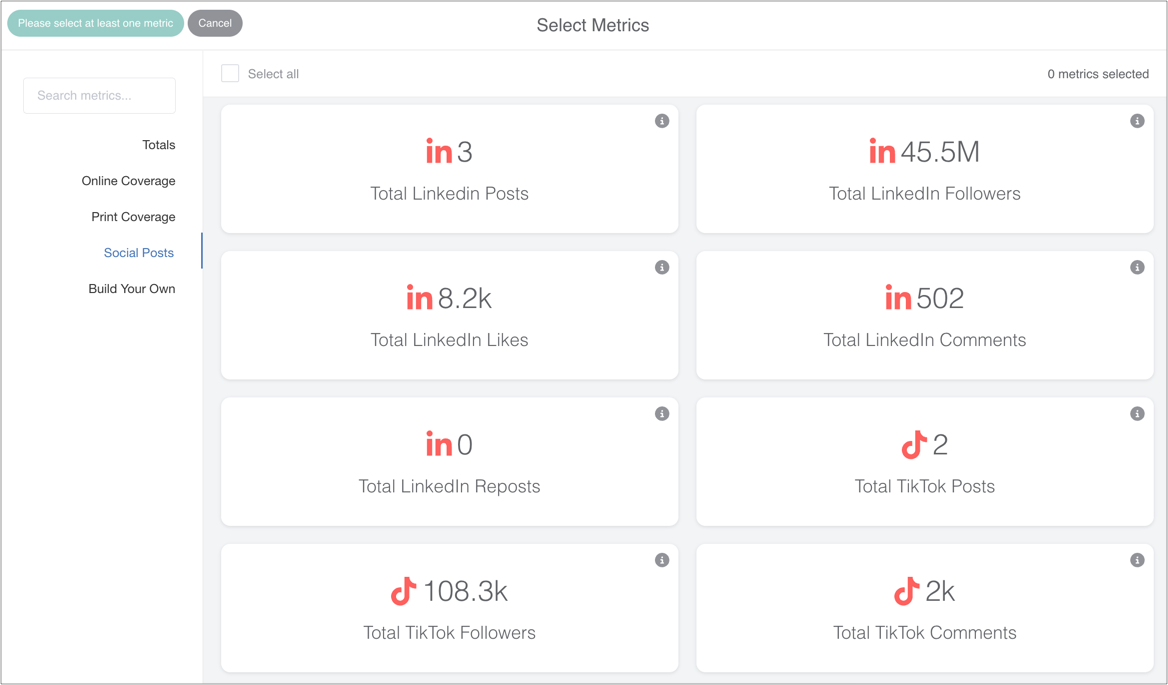
Adding Automated Totals for Online, Print & Social Coverage
The widget presents a selection of totalled metrics covering online, print and social media coverage, based on the content within a report.
Use the side bar, or scroll to explore the options, and select the ones you want to display:
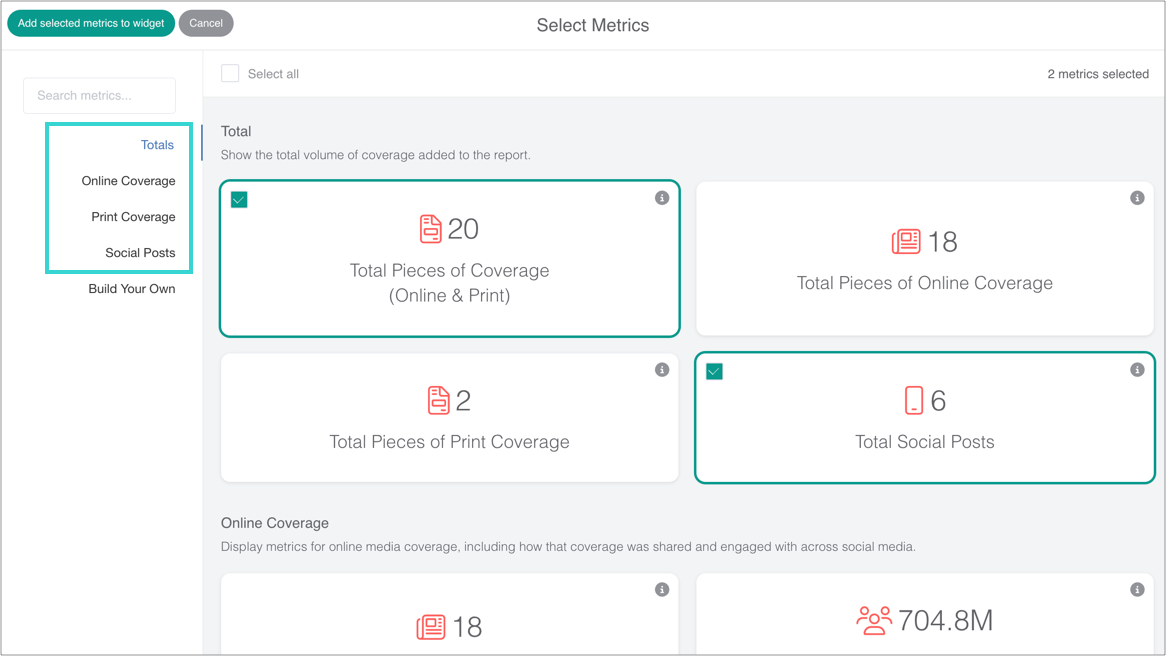
Click 'Add selected metrics to widget' when done.
See a list of all automated PR and social metrics.
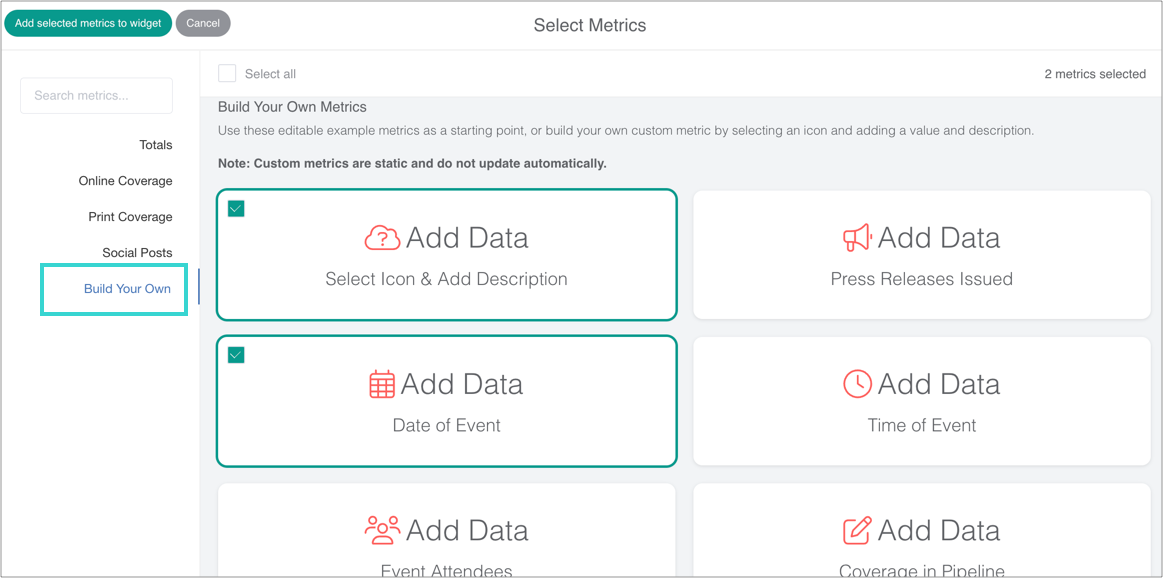
Adding Custom KPIs
You can create custom metrics from scratch - but we've also added some common use cases that can be easily updated, for example:
Dates
Times
Number of Event Attendees
Coverage in Pipeline
Awards Won
Scroll down to the 'Build Your Own' section and select one or more options.
Click 'Add selected metrics to widget' when done.
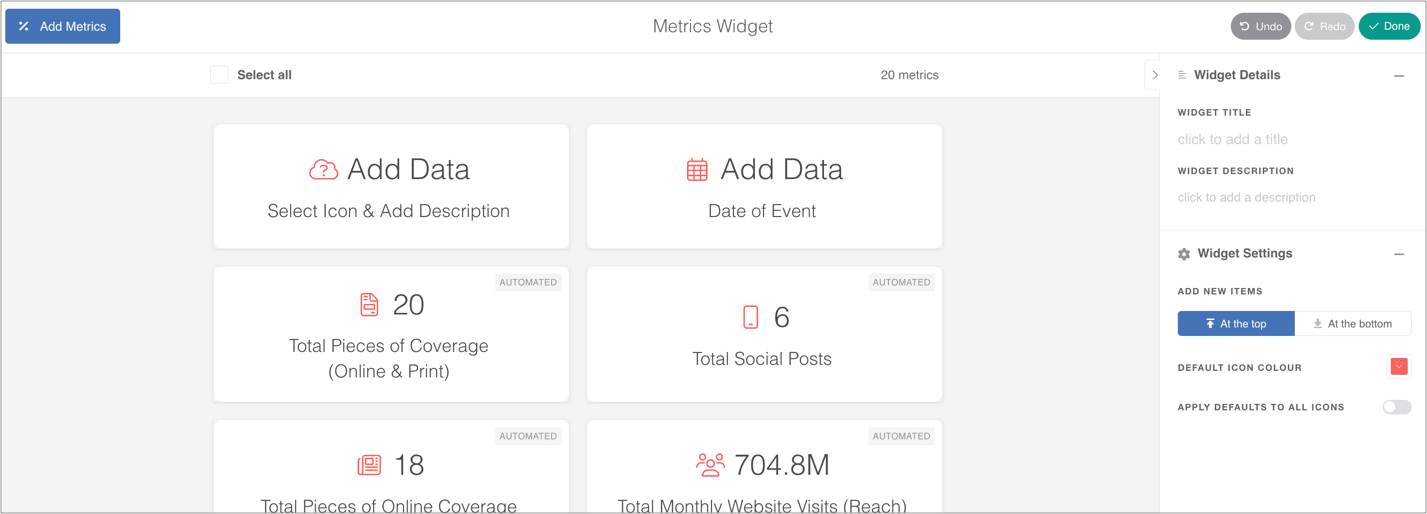
If custom metrics have been added, you can now finalise their content. They consist of an icon, data and description.
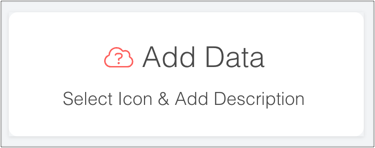
Simply click on each element to tailor it to your needs:

Note: for automated metrics, users can change the icon and description, but not the data as that is generated from content in the report.
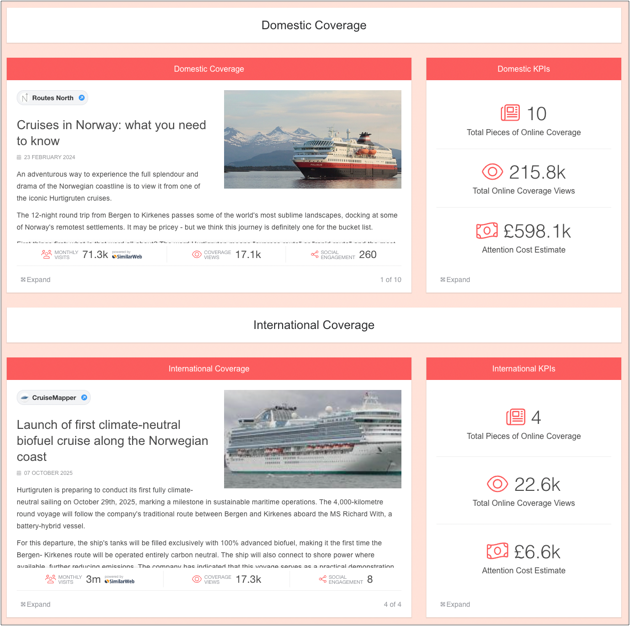
Reporting on Specific Sections (Coverage Regions, Tiers etc)
It's possible to show data for specific widgets only. This is helpful when reporting on different regions, tiers, proactive/reactive coverage etc in the same report.
This works for Online, Social and Print coverage.
To show data for particular elements of the report, use the filter in the sidebar.
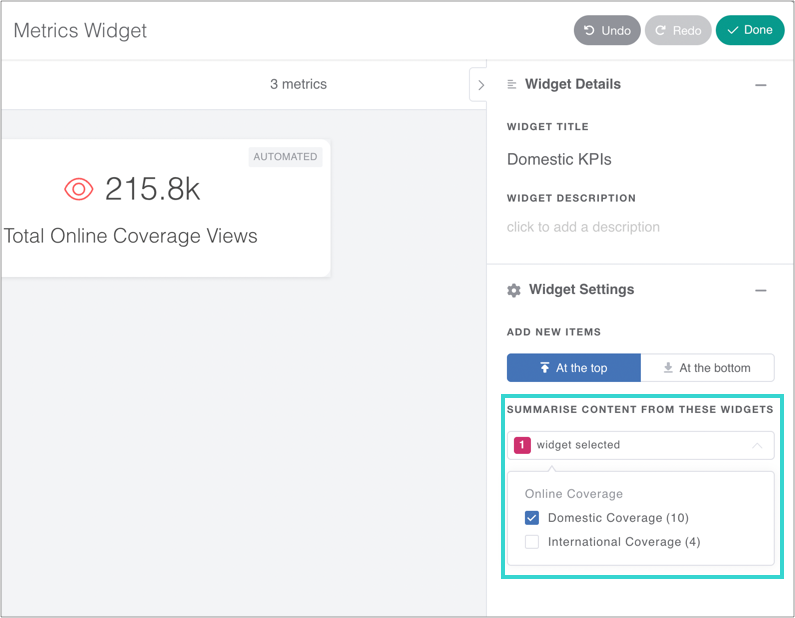
Top tip: be sure to give each widget a unique name so it can easily be identified in the filter.
More Options
Metrics can be reordered, deleted and cloned.
Widget settings can be found in the sidebar to the right.