The Charts & Graphs widget is arguably the most powerful in Releasd, because it helps PRs prove the value of their work.
Users can select from a range of charts which provide evidence that their efforts have raised brand awareness, impacted audiences and ultimately helped achieve overall objectives.
See a summary of all available charts below, then learn how to add them to a Releasd report.
1. A Summary of all Charts in the Evaluation widget
Note: For total figures presented in a visual infographic (Coverage Views, Print Circulation, Attention Earned, Social Post Engagements & more) please see the Summary Metrics widget.
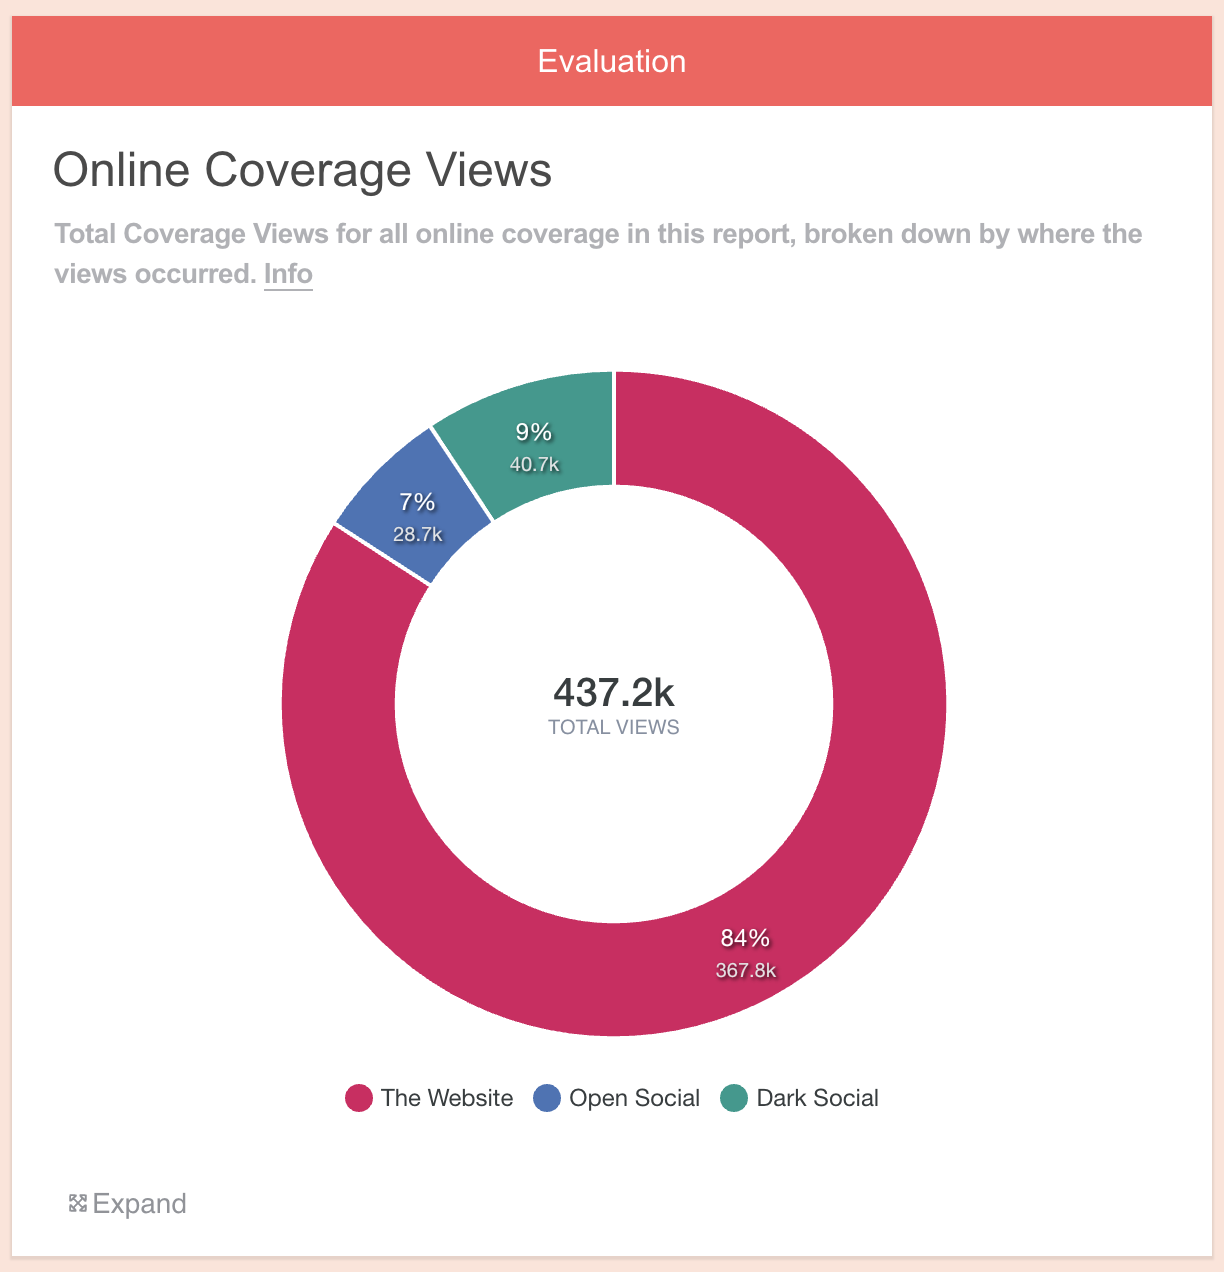
Online Coverage Views by Source
Show the source of online coverage views: website, open social, or dark social. Learn more.
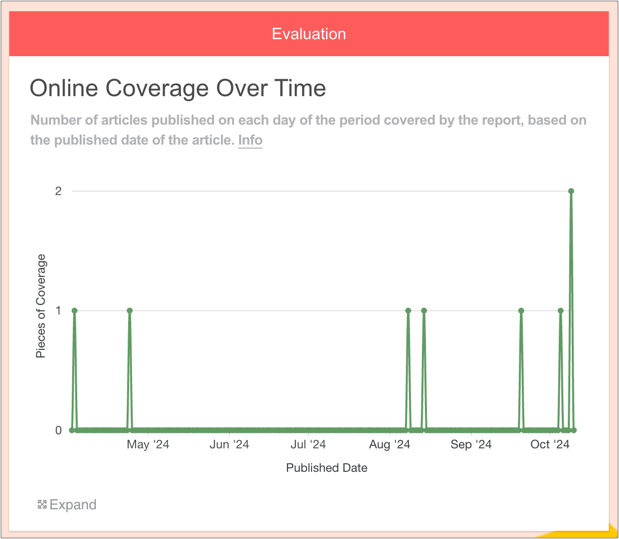
Online Coverage Over Time
Show online coverage in a timeline chart to spot key moments a glance. Learn more.
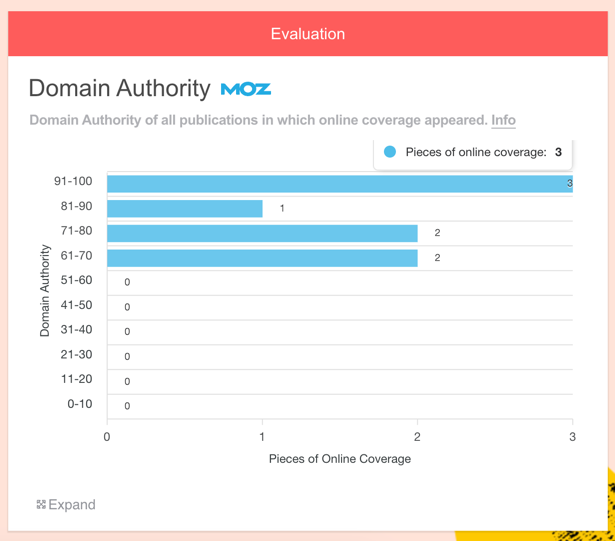
Domain Authority
Visualise online coverage grouped by the Domain Authority of the publishing site. Learn more.
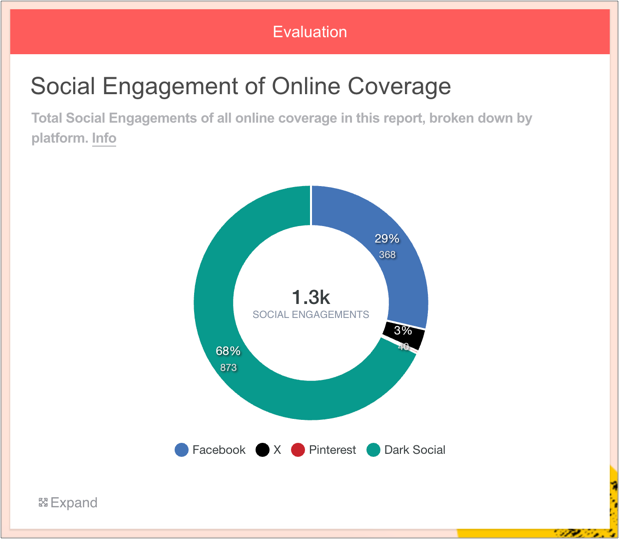
Social Engagement of Online Coverage
Show Social Engagements of online coverage, broken down by platform, to prove that your story made an impact. Learn more.
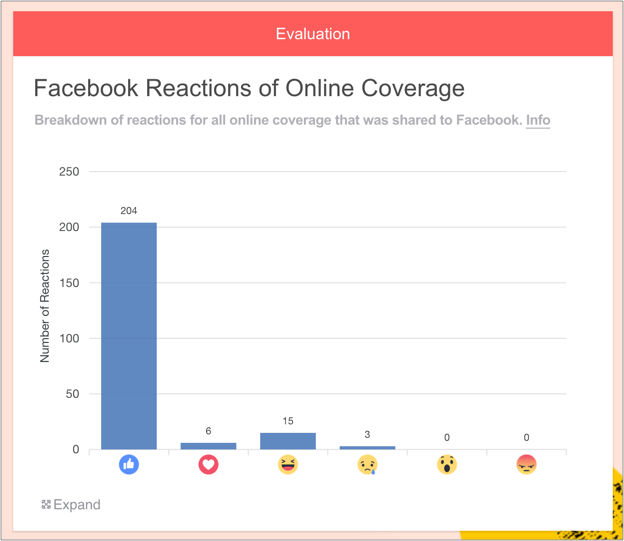
Facebook Reactions of Online Coverage
Show social sentiment with a breakdown of user Reactions to all online coverage that was shared to Facebook. Learn more.
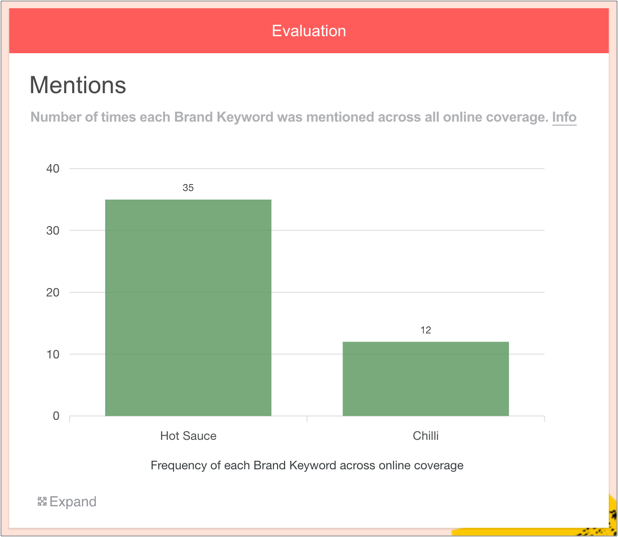
Mentions
Show the number of times a Brand Keyword appeared across online coverage. Learn more.
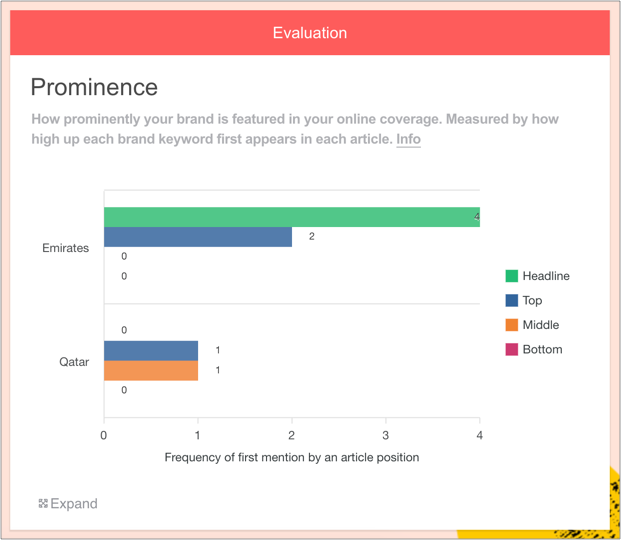
Prominence
Track the first mention: headline, top, middle or bottom of an article. Learn more.
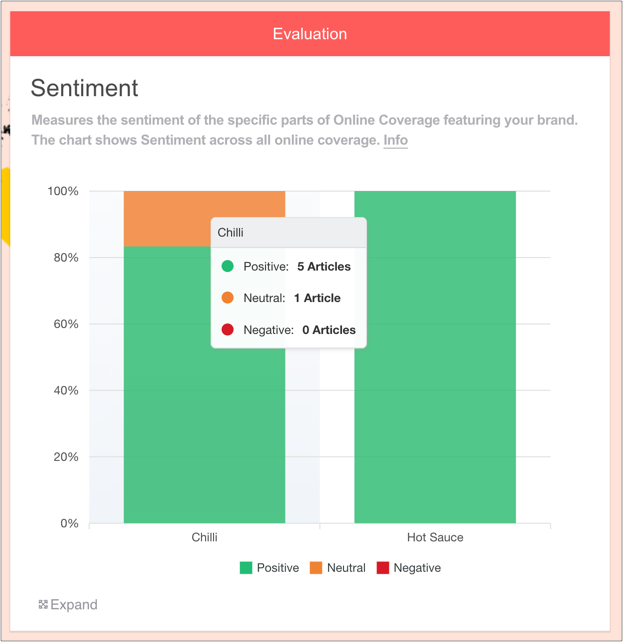
Sentiment
Measure the tone of specific Brand Keywords within coverage. Learn more.
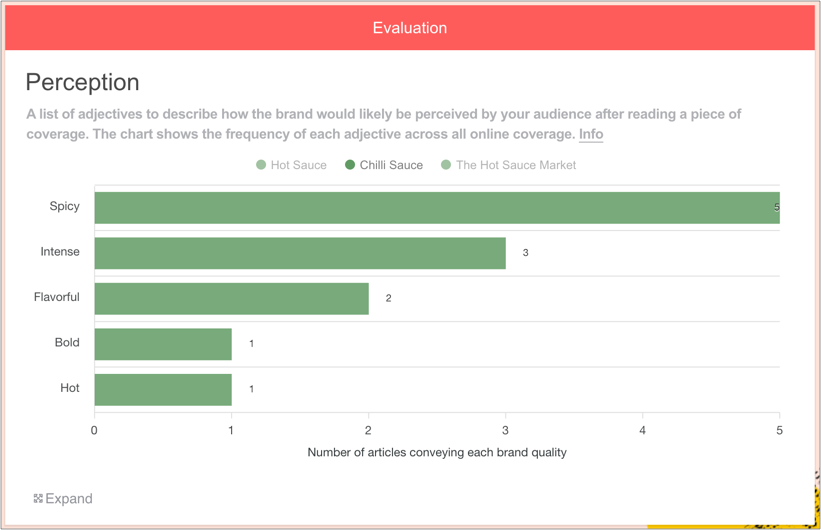
Perception
Get on-demand reputation analysis - no need for costly surveys or focus groups. Learn more.
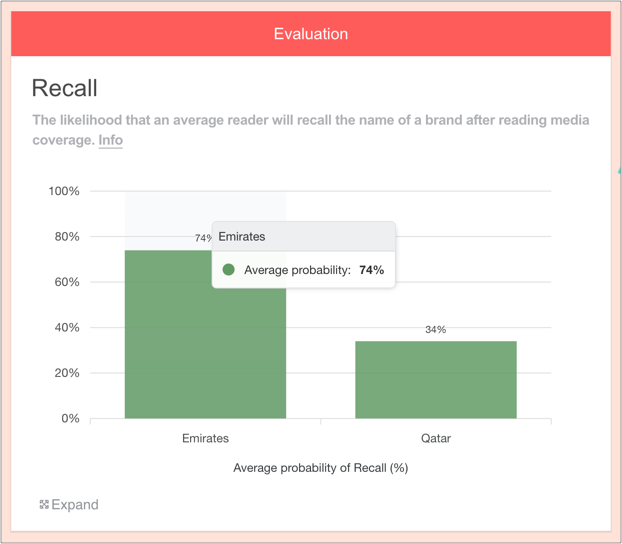
Recall
Show the likelihood that your brands will be remembered after reading coverage. Learn more.
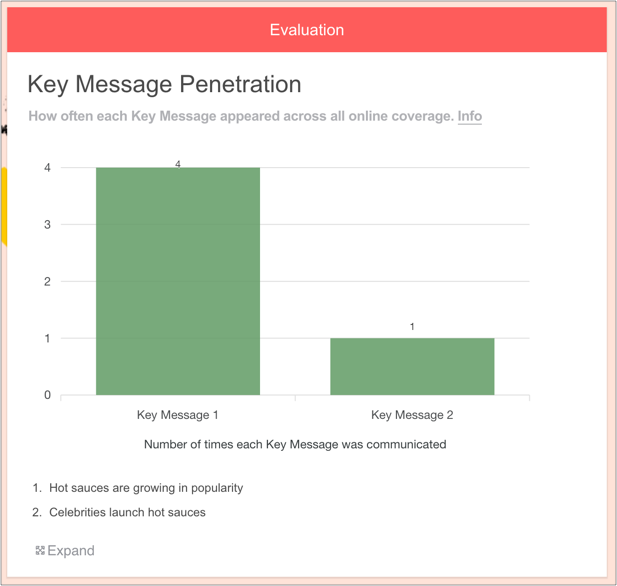
Key Message Penetration
Prove that a your most important points have been successfully communicated. Learn more.
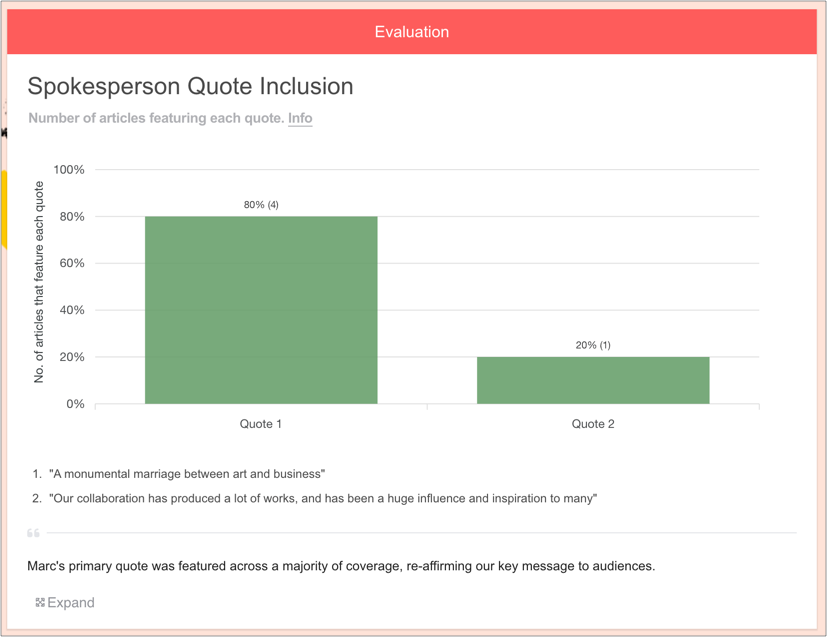
Spokesperson Quote Inclusion
Track appearances of spokesperson quotes across all online coverage, even if the quotes are split within an article. Learn more.
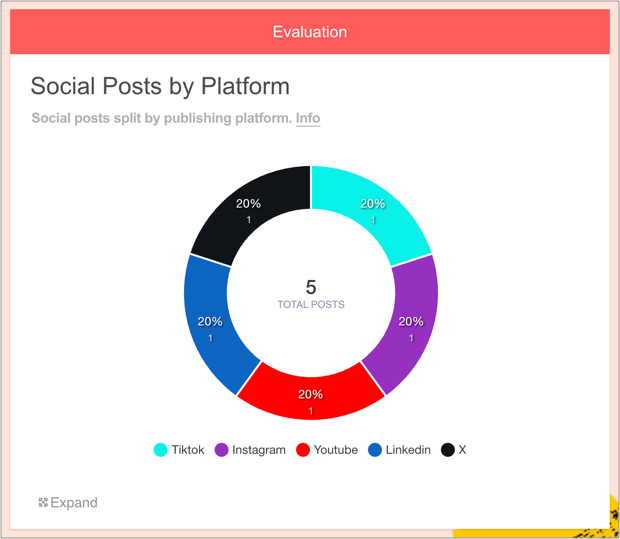
Social Posts by Platform
Show social posts split by the platform on which they appeared. Learn more.
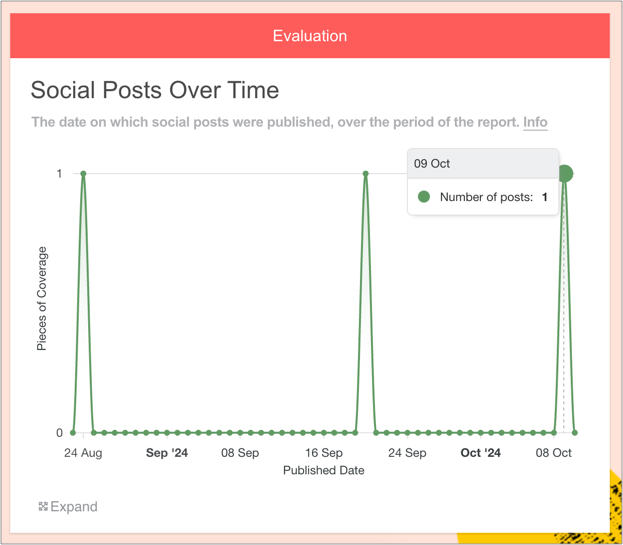
Social Posts Over Time
Show the number of Social Posts that were published, by date. Learn more.
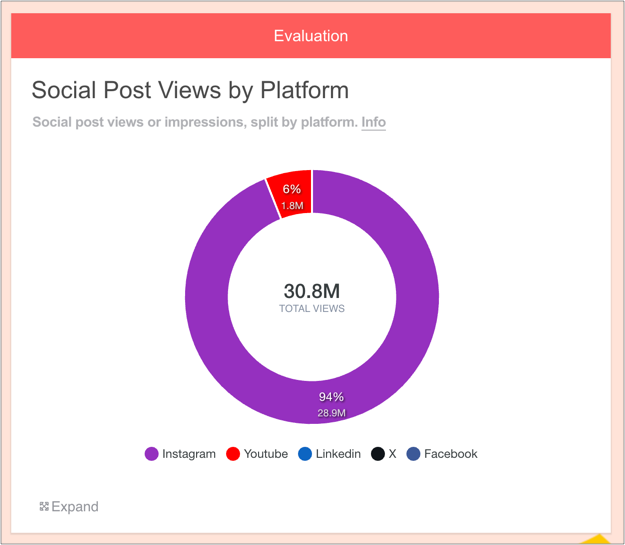
Social Post Views by Platform
Show views of Social Posts, split by channel. Learn more.
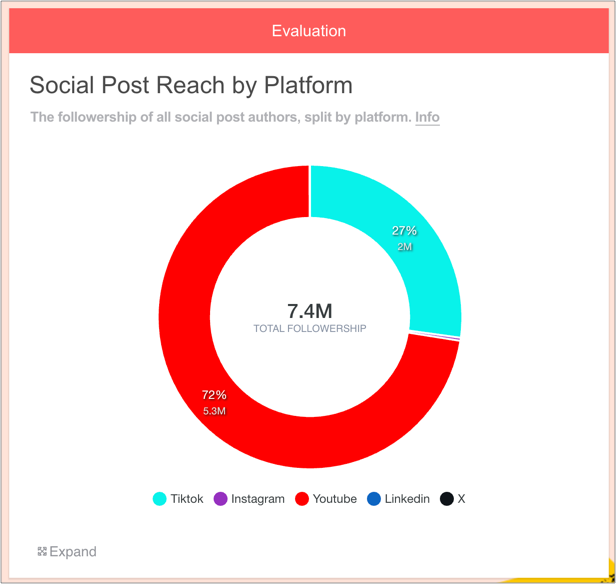
Social Post Reach by Platform
Show the followers of all social post authors, split by platform. Learn more.
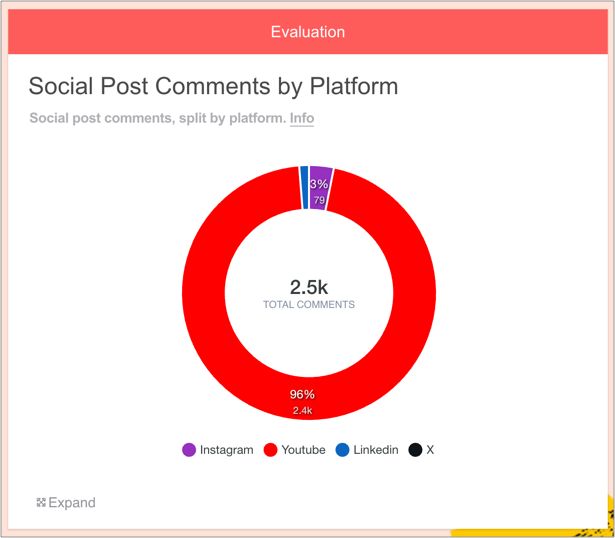
Social Post Comments by Platform
Show Comments on Social Posts, split by channel. Learn more.
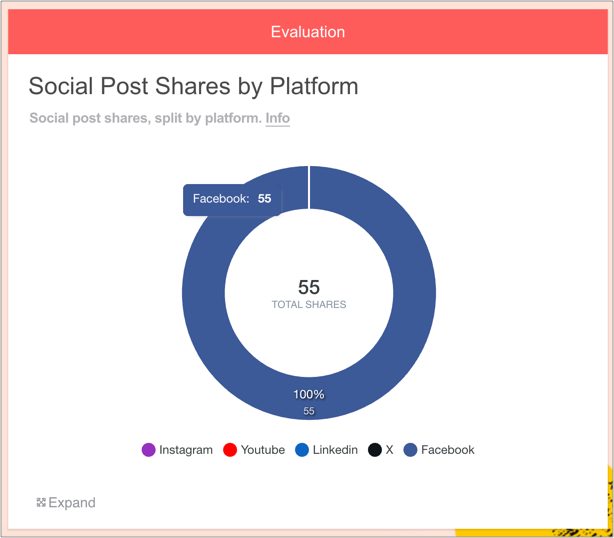
Social Post Shares by Platform
Show Shares of Social Posts, split by channel. Learn more.
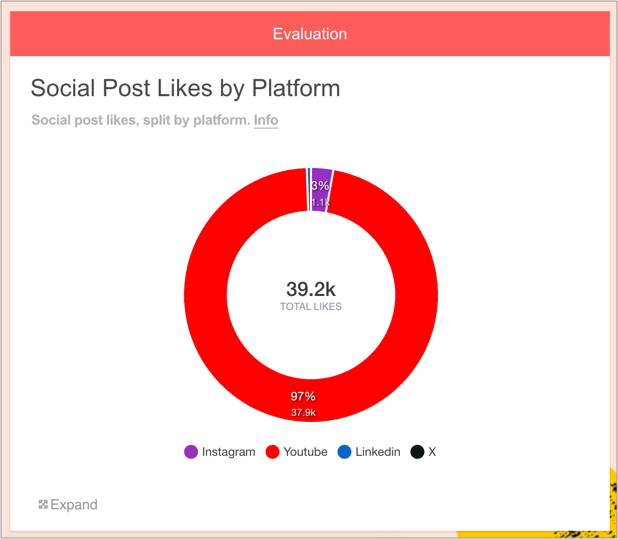
Social Post Likes by Platform
Show Likes of Social Posts, split by the source platform. Learn more.
2. How to add Analytics to a Releasd report with the Evaluation Widget
i) First, add some Online Coverage to your report
Drag on the Online Coverage widget and enter some URLs.
You can learn how to do this here.
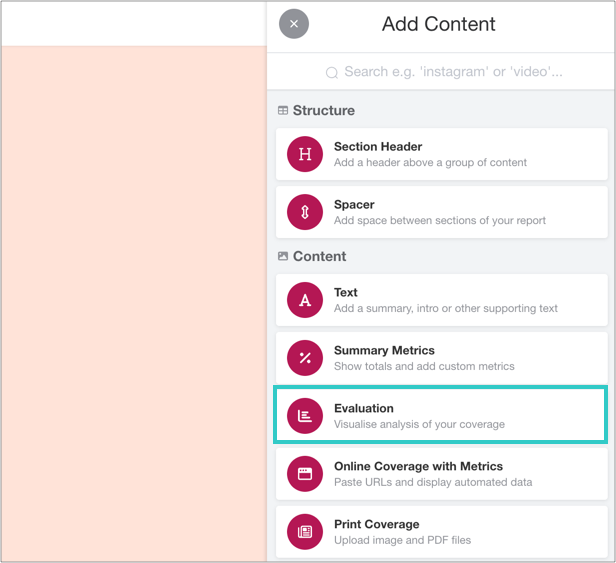
ii) Add an Evaluation widget to your report
You can find this in the Toolbar.
iii) Click 'Add Evaluation'
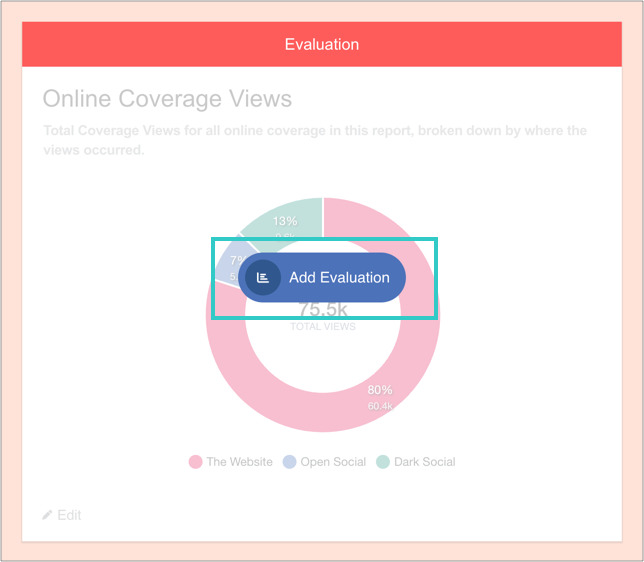
And then 'Add charts':
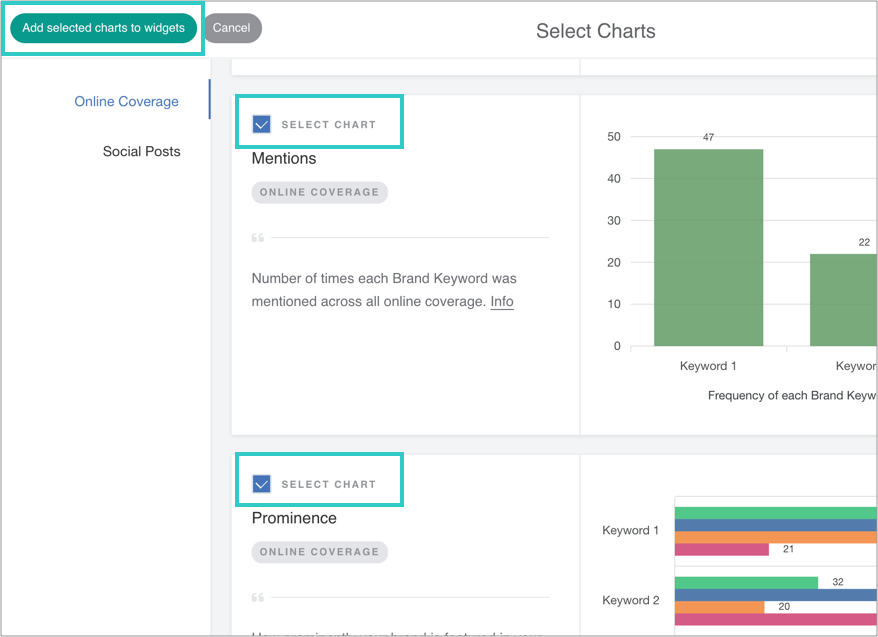
iv) Select from a range of charts, and then add your chosen ones to the widget
v) Some charts can be customised
Follow the specific guides linked from each chart above for instructions.
vi) Save the widget when done
The selected charts will scroll through the widget.