Welcome to the Domain Authority chart deep dive article. Below, we cover:
Overview & Use Cases
How we Measure Domain Authority
How to add the Domain Authority Chart (Evaluation Widget)
How to show Average Domain Authority (Summary Metrics Widget)
1. Overview & Use Cases
The Domain Authority chart can be accessed via the Evaluation widget.
Domain Authority is a search engine ranking score developed by Moz that predicts how likely a website is to rank on search engine results pages compared to competitors, ranging from 1 to 100, with higher scores indicating a greater ability to rank.
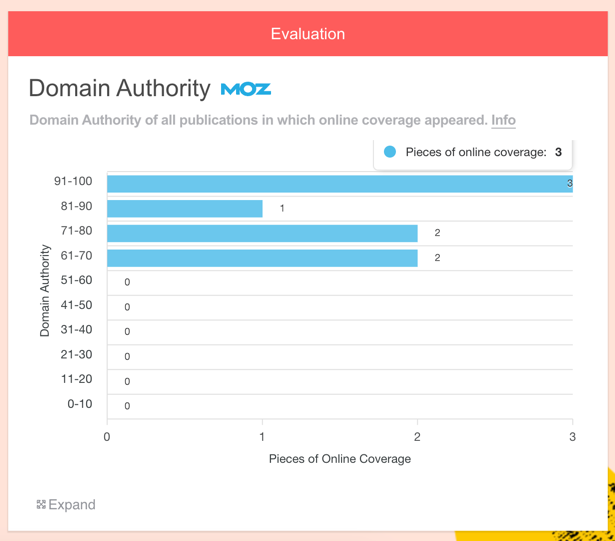
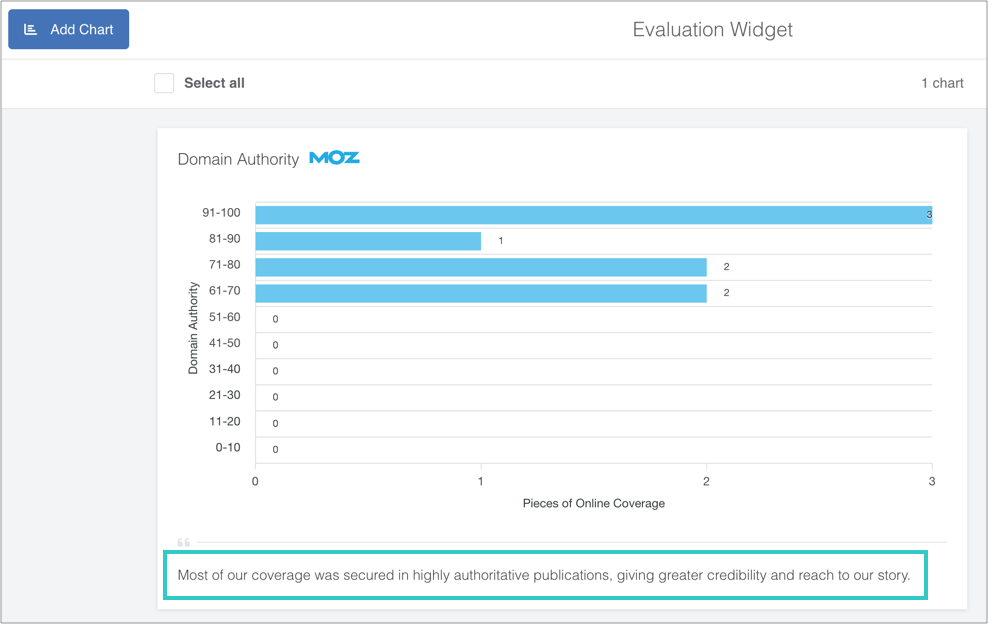
This chart groups online coverage by the Domain Authority of the publishing site, providing a user-friendly overview.
It's worth noting that B2C campaigns tend to achieve coverage on sites with greater Domain Authority because of their broader reach. B2B campaigns may focus on niche sites with more targeted audiences, and these are more likely to have a lower Domain Authorities.
Why it's useful
PRs can use this chart to:
Show the distribution of Domain Authority at a glance; compare with expectations
Prove that they have achieved coverage in infleucneial outlets
Make more informed decisions going forward in terms of targeting
2. How we Measure Domain Authority
We have access to MOZ's API, so can pull the Domain Authority for any website on which online coverage has appeared.
Here it is in the Online Coverage widget.
The Domain Authority chart groups websites by the score.

3. How to add a Domain Authority Chart (Evaluation Widget)
i) First, add some Online Coverage to your report
Drag on the Online Coverage widget and enter some URLs.
You can learn how to do this here.
ii) Add an Evaluation widget to your report
You can find this in the Toolbar.

iii) Click 'Add Evaluation'
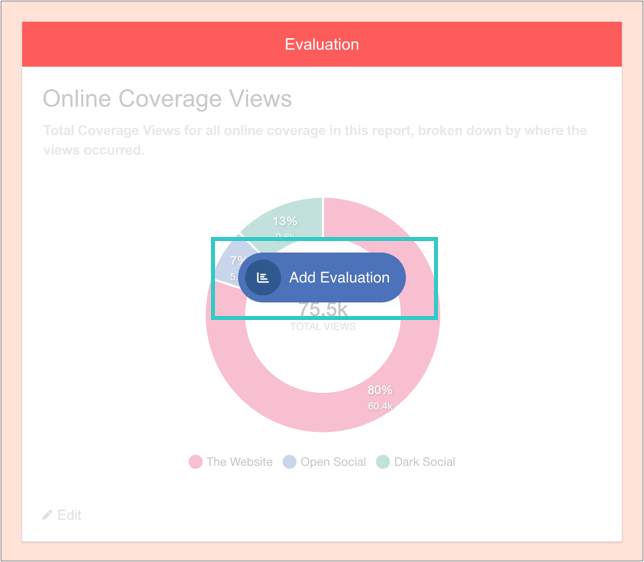
And then 'Add charts':

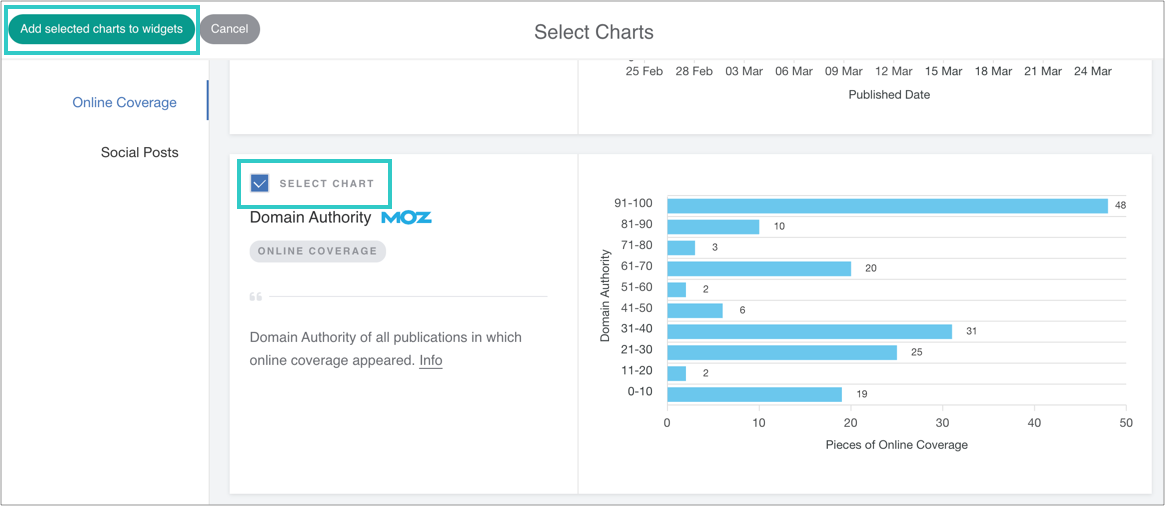
iv) Select the chart, and then add it to the widget
v) Optional: add a caption, reorder or delete the chart
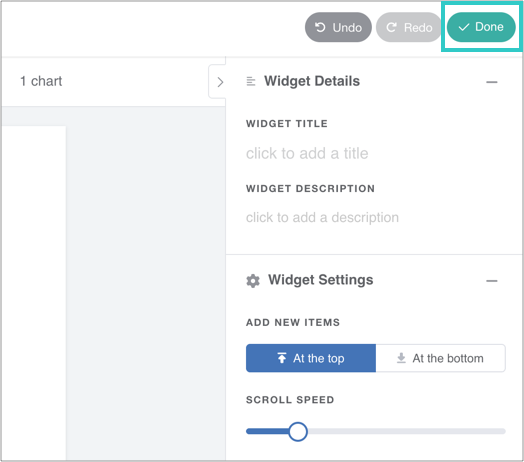
vi) Finally, click 'Done' to save the widget
The chart will automatically update as you add online coverage to the report.
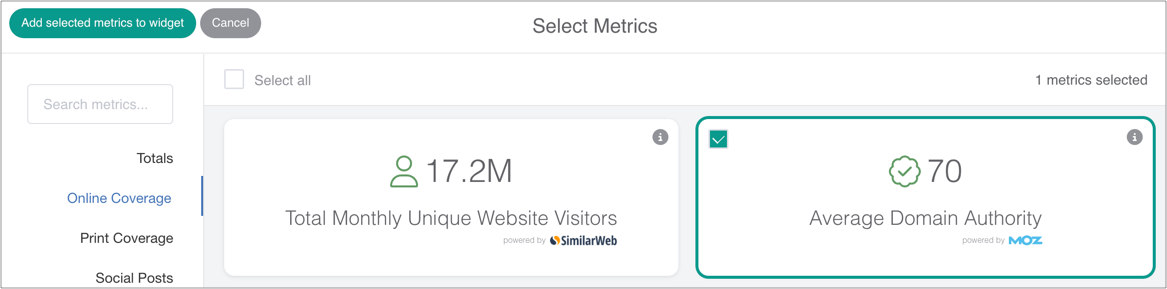
4. How to Show Average Domain Authority (Summary Metrics Widget)
The Summary Metrics widget displays the average Domain Authority of all coverage within a report.
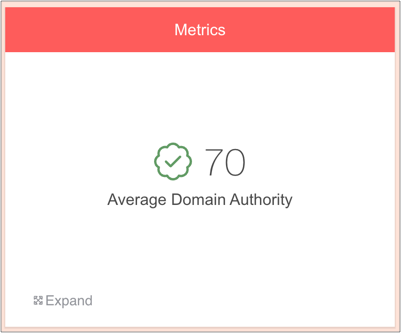
To show Average Domain Authority, simply drag on a Summary Metrics widget, select the relevant metric and save the widget.