Welcome to the Social Engagement of Online Coverage chart deep dive article. Below, we cover:
Overview & Use Cases
How we Measure Social Engagement of Online Coverage
How to add the Social Engagement of Online Coverage Chart (Evaluation Widget)
How to Show Total Metrics (Summary Metrics Widget)
1. Overview & Use Cases
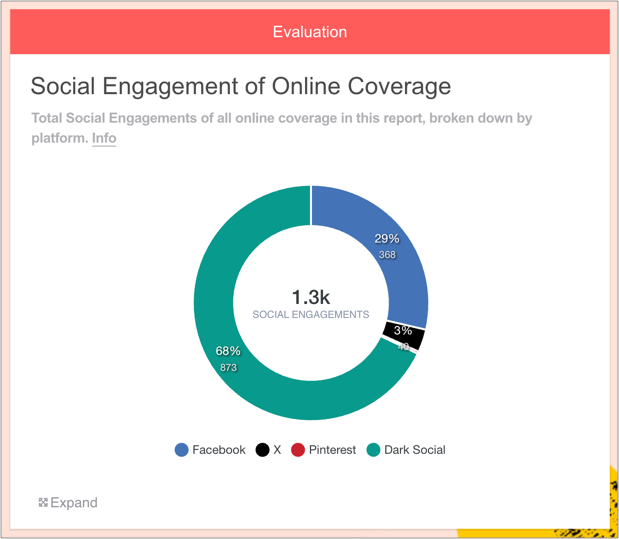
The Social Engagement of Online Coverage chart can be accessed via the Evaluation widget.
It's based on the fact that online coverage can be shared to social media platforms, and be engaged with though Likes, Shares, Comments etc.
This chart shows the platforms on which these social engagements happened.
Why it's useful
PRs can use this chart to:
Demonstrate that online coverage has been shared, and then engaged with by audiences on social media
Show the platforms on which online coverage achieved most engagements, at a glance
Make more informed decisions around story content and distribution going forward
2. How we Measure Social Engagements of Online Coverage
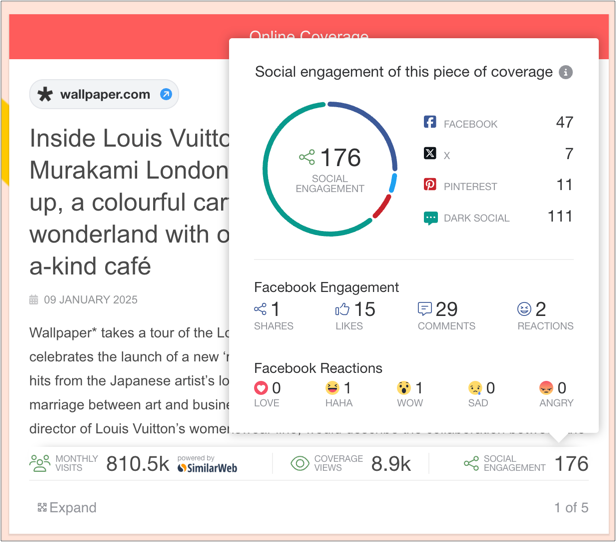
When an article appears online, it can be shared to social media platforms. We are able to measure engagements (Shares, Comments, Likes, Reactions) on those platforms by:
a) querying 'open' social platforms (e.g. X, Facebook, Pinterest) via their API
b) through our own algorithm, estimating how many engagements an article has gained on dark social platforms (which do not have an API). Learn more about Dark Social.
This information is shown per-article in the Online Coverage widget as you can see below.
The Social Engagement of Online Coverage chart aggregates this information, totalling all engagements and displaying them by source.
3. How to add the Social Engagement of Online Coverage Chart (Evaluation Widget)
1. First, add some Online Coverage to your report
Drag on the Online Coverage widget and enter some URLs.
You can learn how to do this here.
2. Add an Evaluation widget to your report
You can find this in the Toolbar.
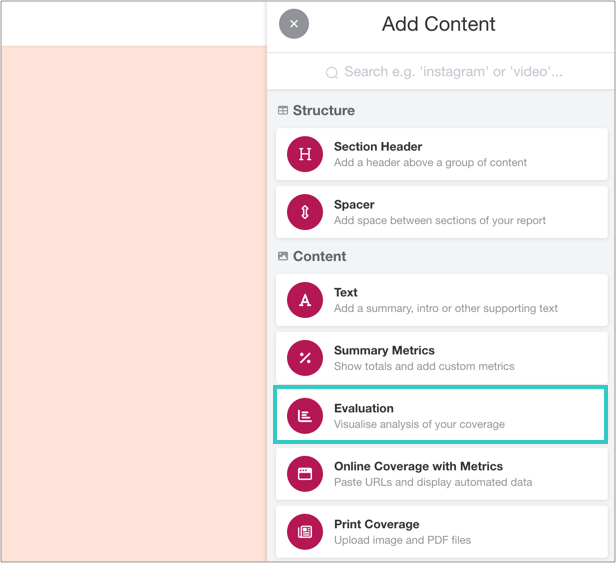
3. Click 'Add Evaluation'
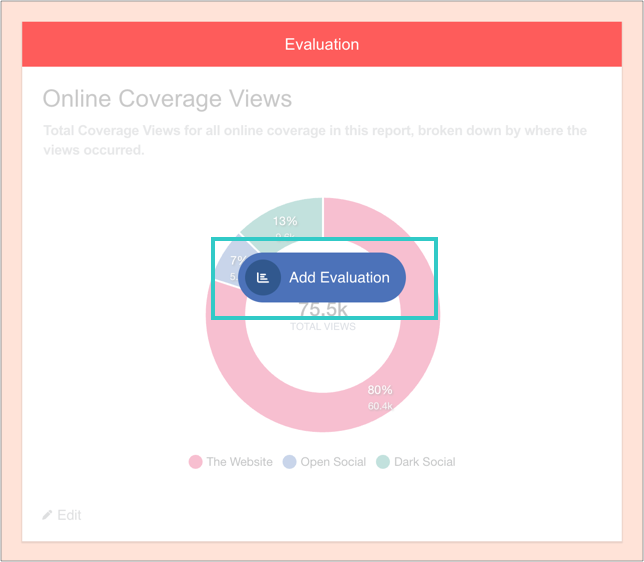
And then 'Add charts':

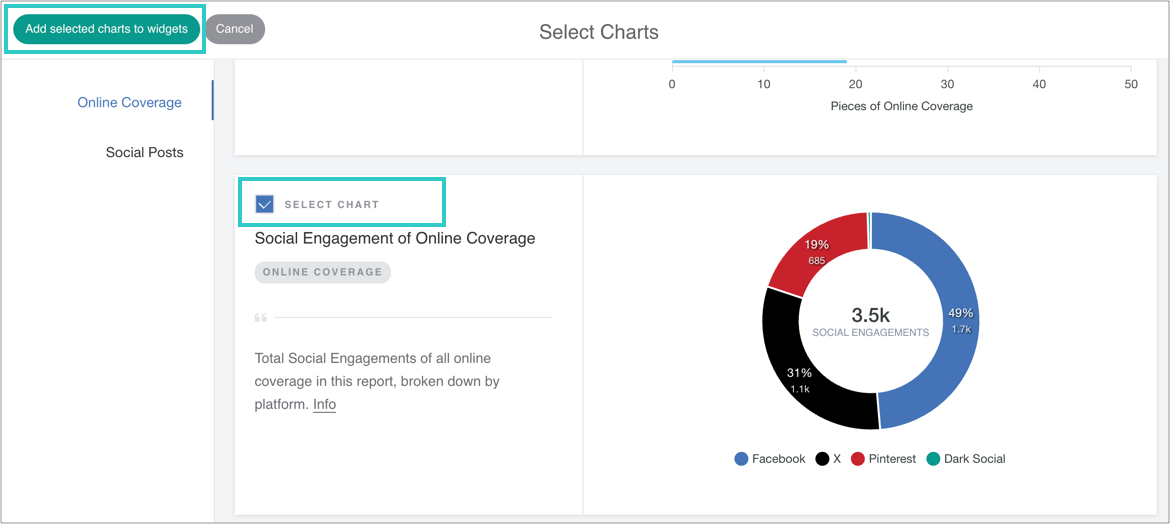
4. Select the chart, and then add it to the widget
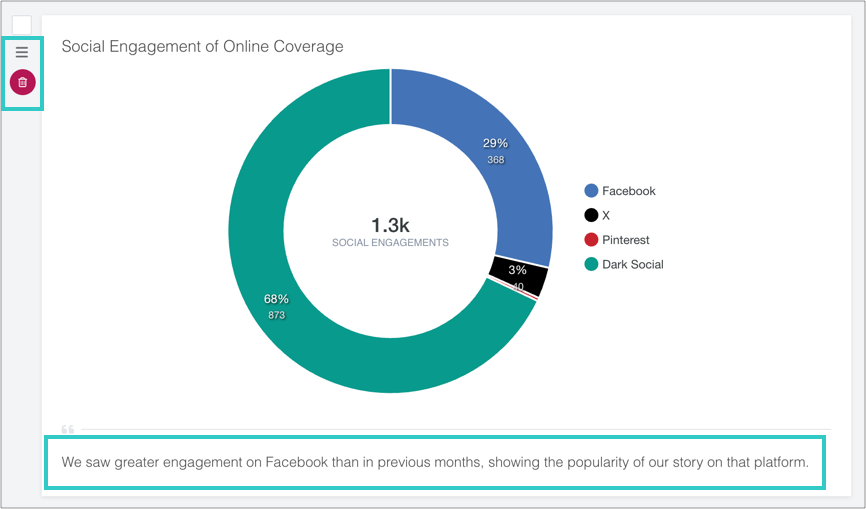
5. Optional: add a caption, reorder or delete the chart
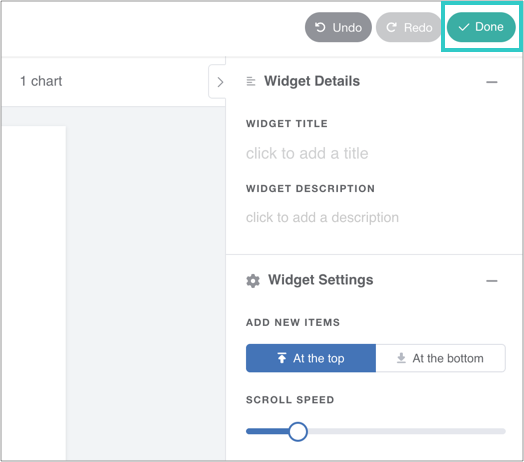
6. Finally, click 'Done' to save the widget
The chart will automatically update as you add online coverage to the report.
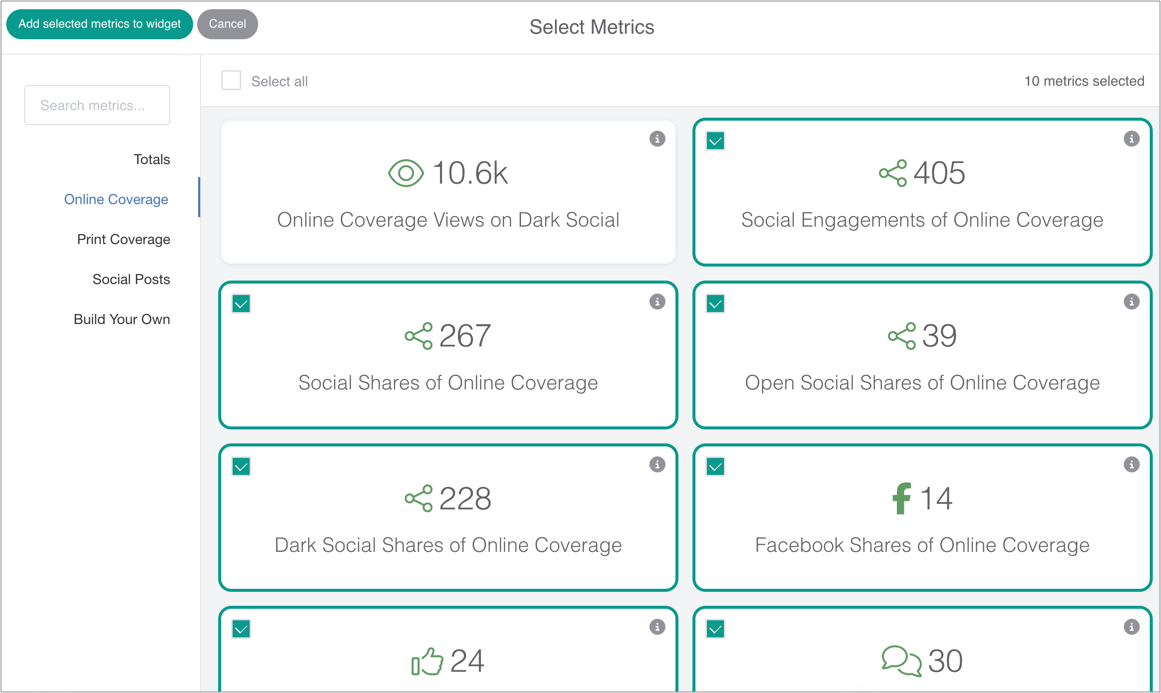
4. How to Show Total Metrics (Summary Metrics Widget)
The Summary Metrics widget totals up all individual metrics in a report. Here, you can display a breakdown of all Social Engagement of Online Coverage Metrics.
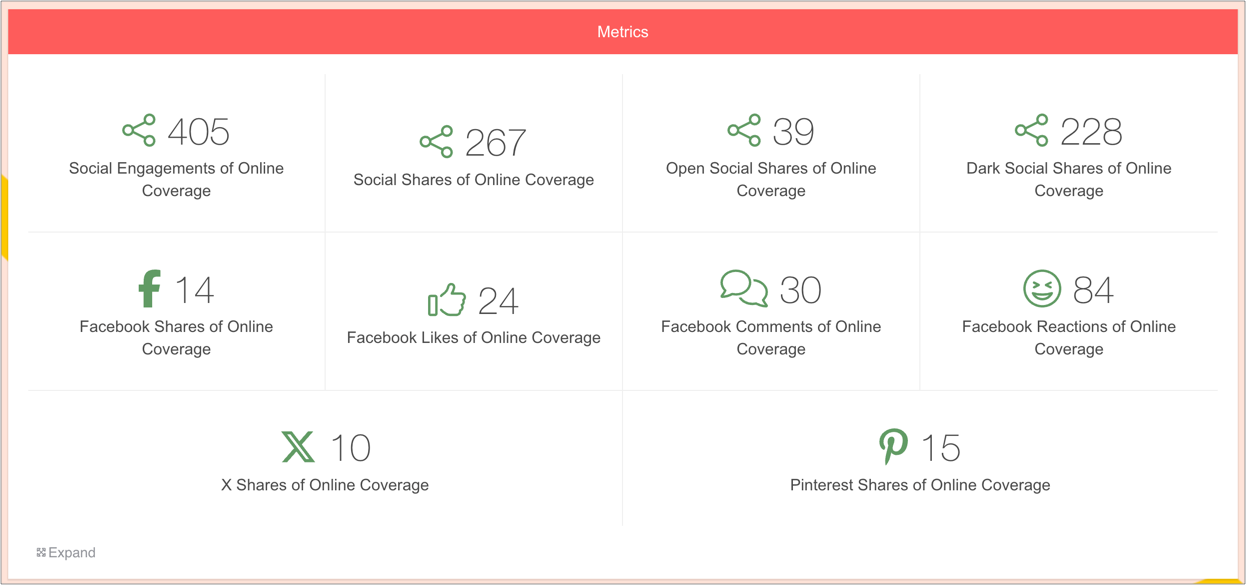
To add metrics for Social Engagements of Online Coverage, simply drag on a Summary Metrics widget, select the relevant metrics and save the widget.