Welcome to the Facebook Reactions of Online Coverage chart deep dive article. Below, we cover:
Overview & Use Cases
How we Measure Facebook Reactions of Online Coverage
How to add the Facebook Reactions of Online Coverage Chart (Evaluation Widget)
How to Show Total Metrics (Summary Metrics Widgets
1. Overview & Use Cases
Note that this data relates to Facebook Reactions to online coverage that has been added to an Online Coverage widget. IE coverage that has been published in an online publication, then shared to Facebook.
Users can also add and analyse native, original Facebook posts via the Social Posts widget.
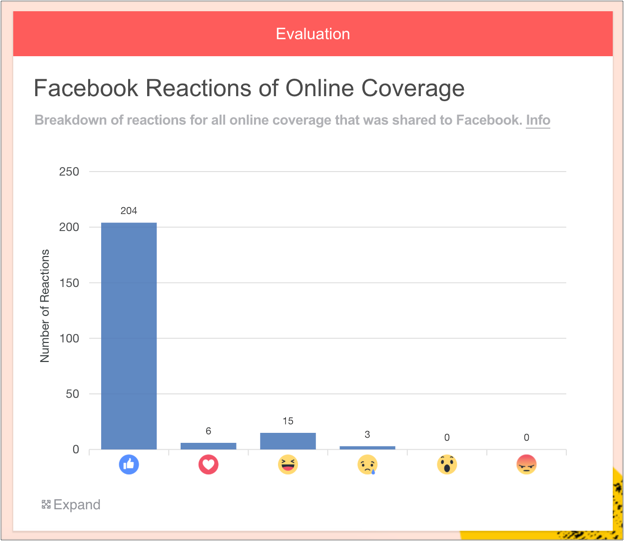
The Facebook Reactions of Online Coverage chart can be accessed via the Evaluation widget.
Online coverage is sometimes shared to social media platforms. Facebook users can click on different icons to show how they feel about a story in their feed. These icons include:
Like
Love
HaHa
Sad
Wow
Angry
Why it's useful
PRs can use this chart to:
Understand the genuine sentiment of readers, at scale, on social media
Compare real Reactions with original intent (e.g. an uplifting story which engenders an 'Angry' response = not good!)
Learn what aspect of the story prompted a Reaction and leverage this for future campaigns
2. How we Measure Facebook Reactions of Online Coverage
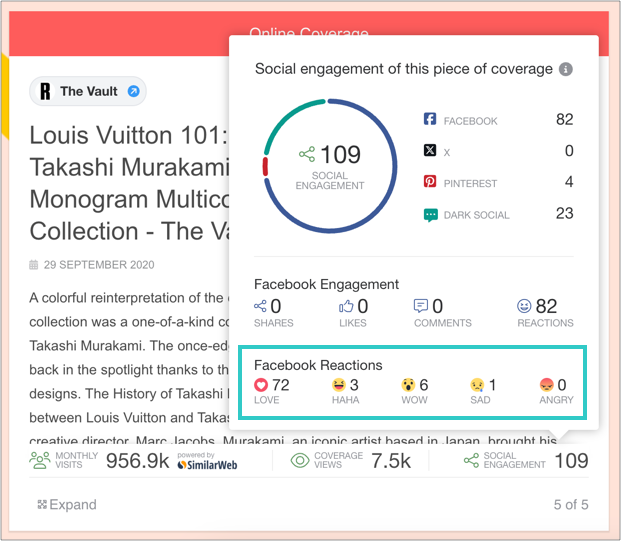
To gather Reactions from Facebook, we connect to their API, share the Online Coverage URL, and they provide us with a breakdown of Reactions.
This is displayed in the Online Coverage widget per article, and displayed in the Facebook Reactions of Online Coverage chart to provide an overview.
3. How to add the Facebook Reactions of Online Coverage Chart (Evaluation Widget)
1. First, add some Online Coverage to your report
Drag on the Online Coverage widget and enter some URLs.
You can learn how to do this here.
2. Add an Evaluation widget to your report
You can find this in the Toolbar.
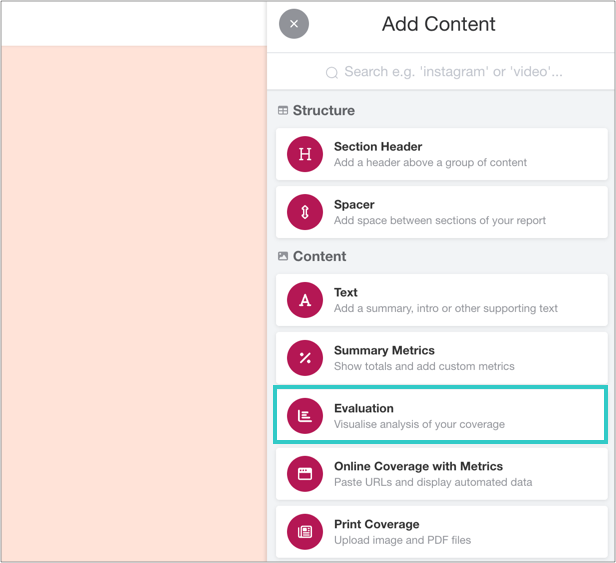
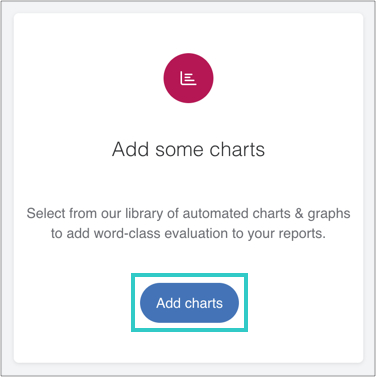
3. Click 'Add Evaluation'
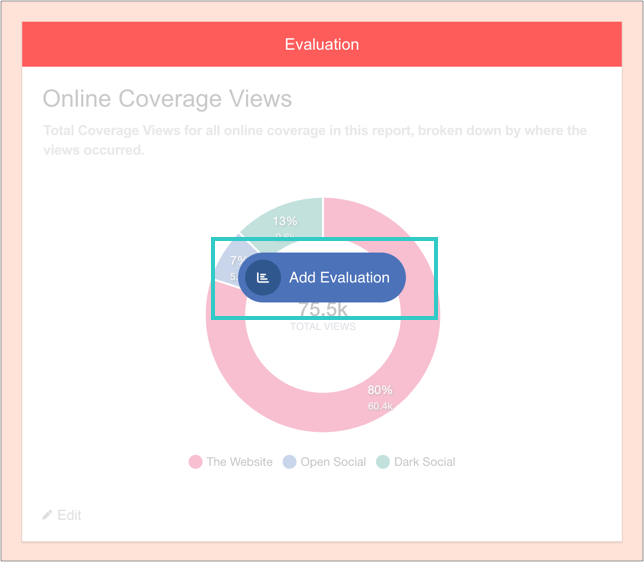
And then 'Add charts':
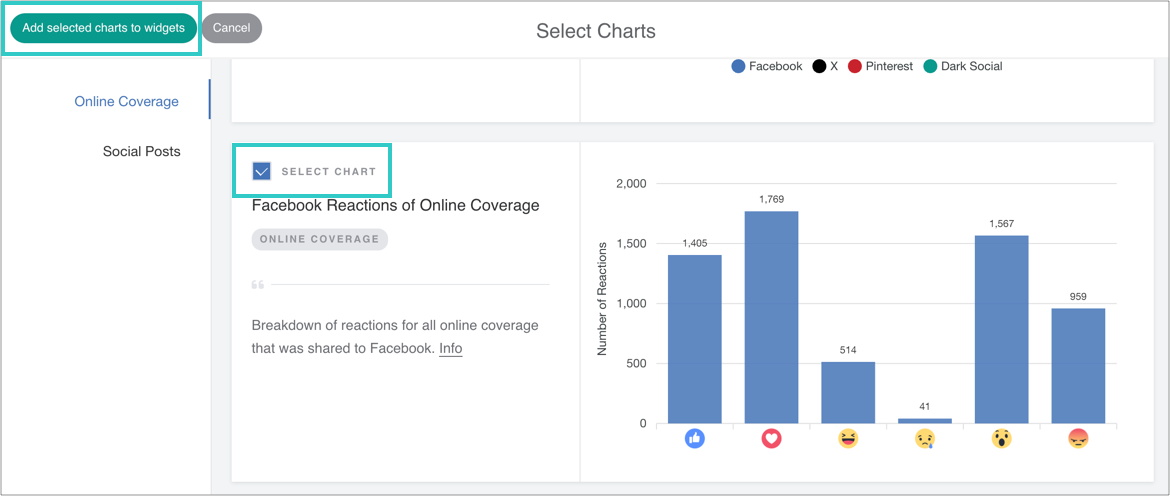
4. Select the chart, and then add it to the widget
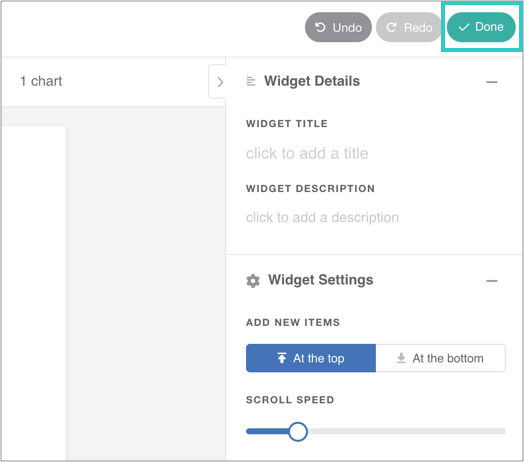
5. Optional: add a caption, reorder or delete the chart
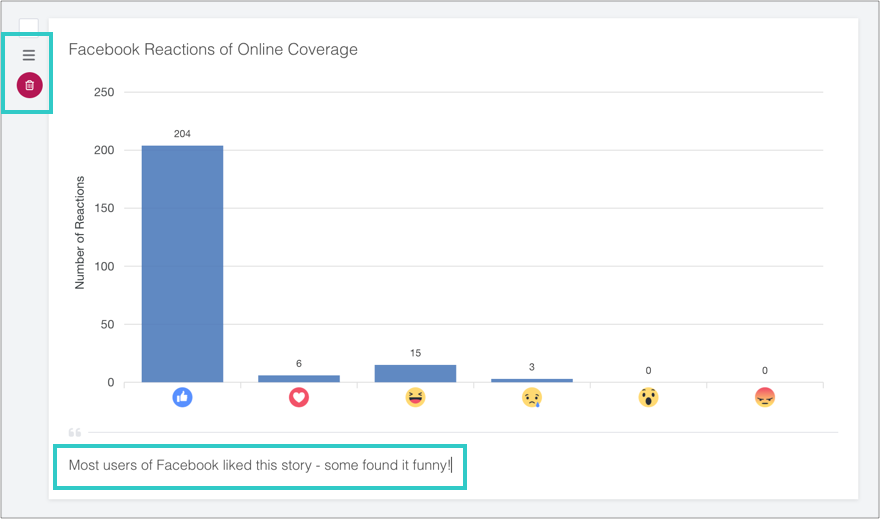
6. Finally, click 'Done' to save the widget
The chart will automatically update as you add online coverage to the report.
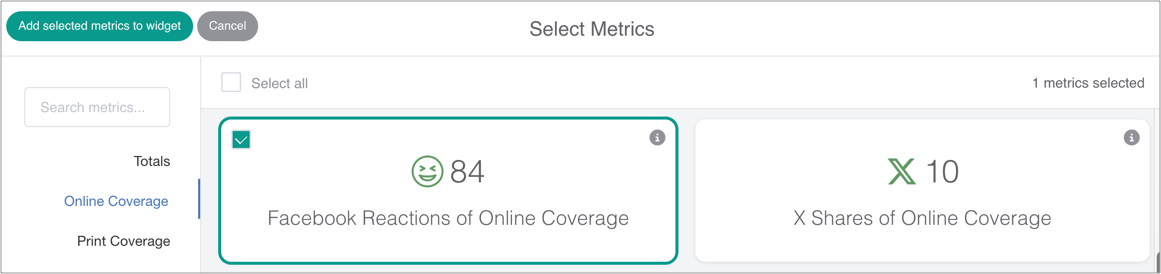
4. How to Show Total Metrics (Summary Metrics Widget)
The Summary Metrics widget totals up all individual metrics in a report, including Facebook Reactions of Online Coverage.
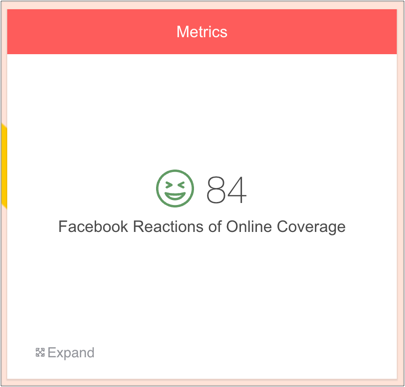
To add metrics for Facebook Reactions of Online Coverage, simply drag on a Summary Metrics widget, select the relevant metrics and save the widget.