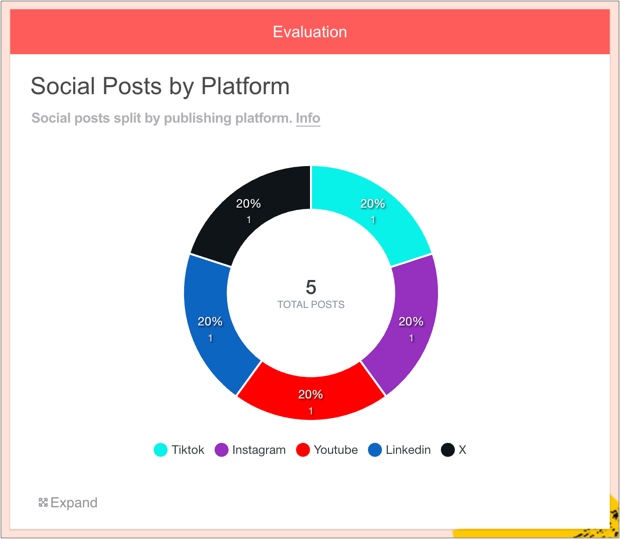
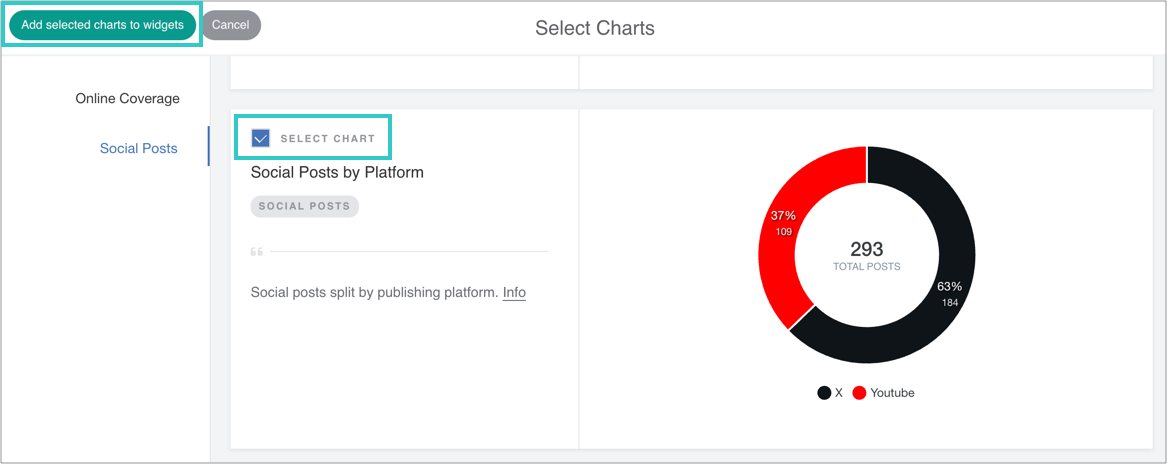
The Social Posts by Platform chart can be accessed via the Evaluation widget.
It displays the total number of social posts added to the report, broken down by the platforms on which they appeared.
Why it's useful
When users add content to the Social Posts widget it shows individual posts with the metrics for each one; however it doesn't show how many posts there were per platform.
PRs can use this chart to:
Summarise their traction across different platforms at a glance (YouTube, LinkedIn, Instagram, Pinterest, X, Facebook)
Determine if KPIs are being met
Compare with other reports to see changes over time
How to add this chart
1. First, add some Social Posts to your report
Drag on the Social Posts widget and enter some URLs.
You can learn how to do this here.
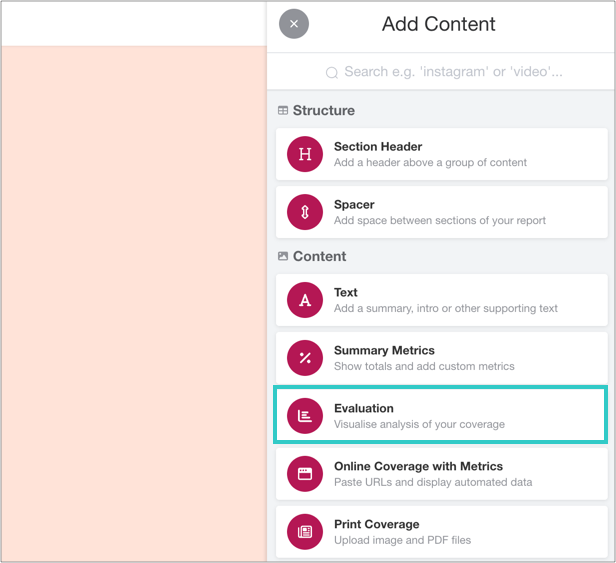
2. Add an Evaluation widget to your report
You can find this in the Toolbar.
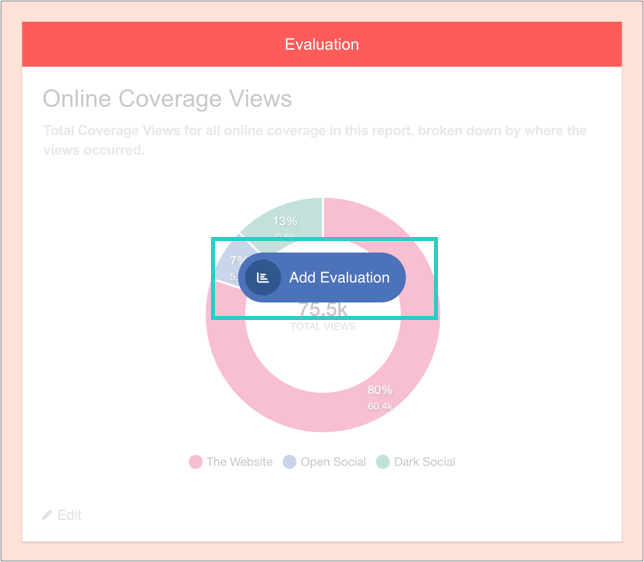
3. Click 'Add Evaluation'
And then 'Add charts':

4. Select the chart, and then add it to the widget
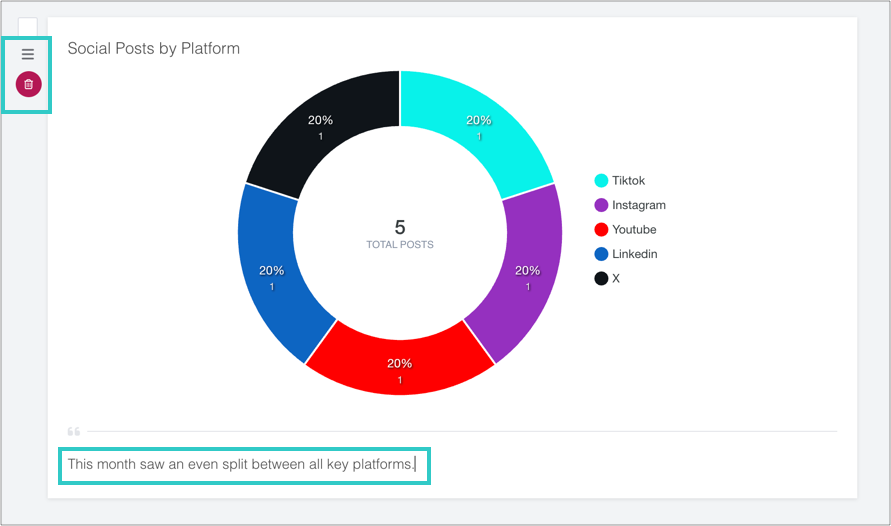
5. Optional: add a caption, reorder or delete the chart
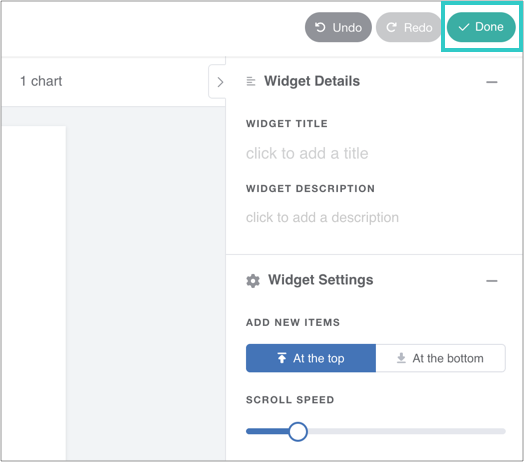
6. Finally, click 'Done' to save the widget
The chart will automatically update as you add online coverage to the report.