Welcome to the Prominence deep dive article. Below, we cover:
Prominence Overview & Use Cases
How we Measure Prominence
How to add a Prominence Chart (Evaluation Widget)
1. Prominence Overview & Use Cases
As PR professionals, we know that a successful campaign is one in which the media has helped us reach and influence our target audience.
But how can we prove that this has happened?
One way of doing so is by detecting the position of the first mention of a brand; does it feature in the headline, top, middle or bottom of the article?
In terms of visibility and impact, we understand intuitively that headline mentions are far more valuable than those at the very bottom.
Measuring Prominence manually is time consuming and prone to error. This article will demonstrate how PRs can do this automatically, for multiple brands, across all online coverage within their report.
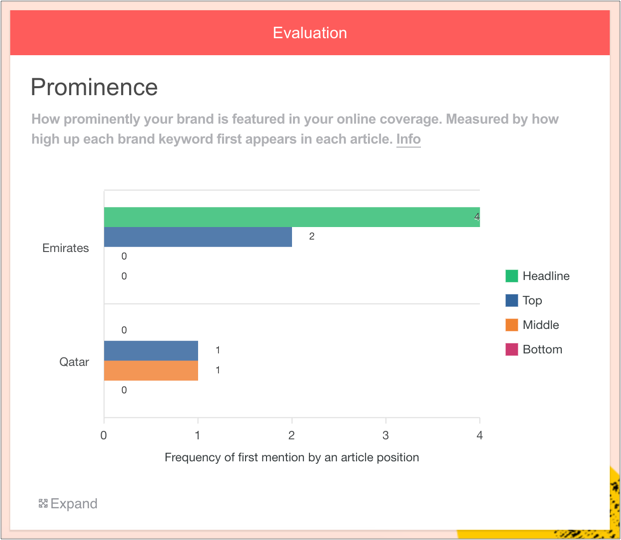
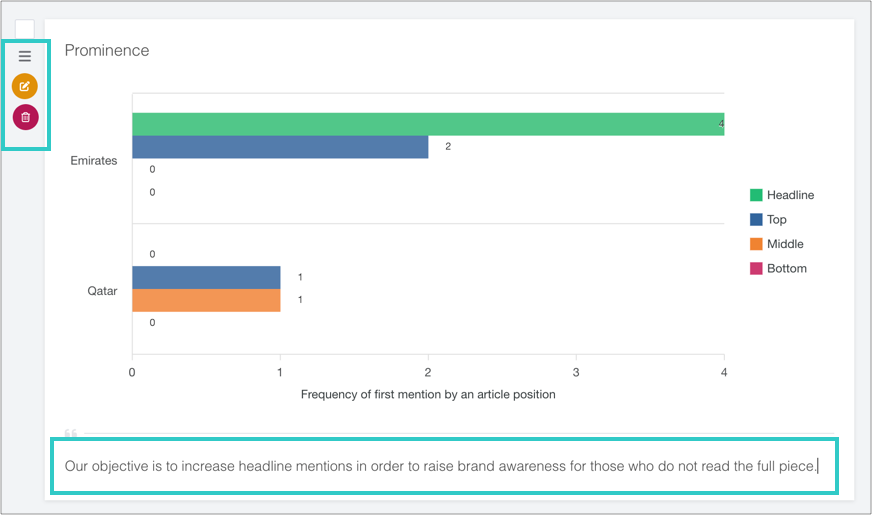
Here, we see that Emirates appeared in the Headline and Top of coverage, whereas Qatar appeared in the top and middle.
Why Prominence is useful
PRs use Prominence to:
Prove that they have raised brand awareness, and infer likely impact on audience
Get a quick overview of where a brand tends to be placed, especially for review-led campaigns (e.g. comparisons, top 10s),
Compare the performance of different Brand Keywords side-by-side
Make more informed decisions about story development and media outreach going forward
2. How we Measure Prominence
The process of analysing Prominence works as follows:
Online coverage is added to a Releasd
We detect the headline, top, middle and bottom portions
Our systems look for appearances of the Brand Keywords that you provide - and which portion of the article they first appear in
The Prominence is captured and plotted on a bar chart
For example, if the Brand Keyword is 'Emirates' and it appears in the headline and middle of an article, that will be counted once as Headline (whereas in the Mentions chart, the Brand Keyword count for that article would be 2).
3. How to add a Prominence Chart (Evaluation Widget)
i) First, add some Online Coverage to your report
Drag on the Online Coverage widget and enter some URLs.
You can learn how to do this here.
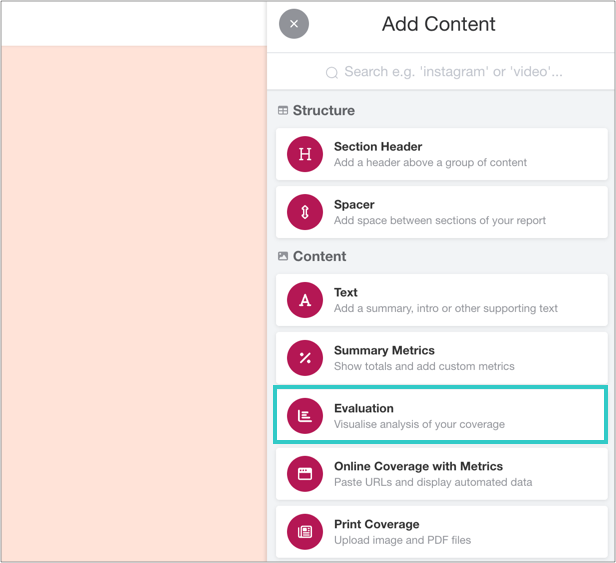
ii) Add an Evaluation widget to your report
You can find this in the Toolbar.
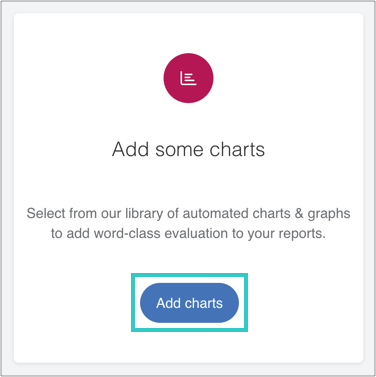
iii) Click 'Add Evaluation'
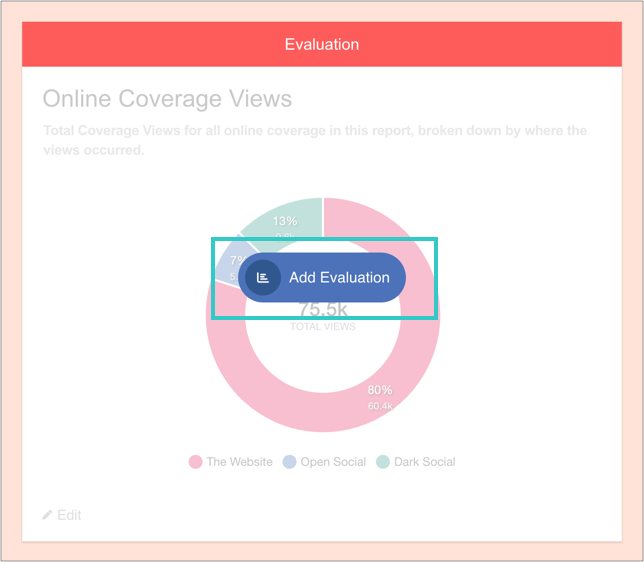
And then 'Add charts':
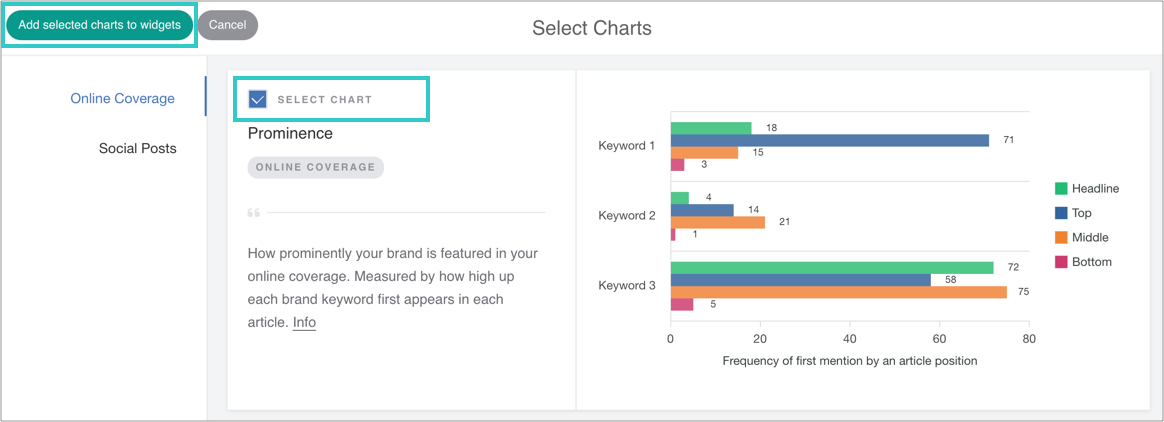
iv) Select the Prominence chart, and then add it to the widget
v) Managing Brand Keywords
A Brand Keyword in this context refers to the specific entity that has been promoted through PR - such as a company, campaign, product, service, person or event.
It's what you expect to appear in your media coverage, and what will be evaluated in your report.
Brand Keywords must be spelled accurately, but are not case sensitive.
Examples of Brand Keywords:
✅ Adobe Acrobat or adobe acrobat (a product, using upper or lower case letters)
✅ Levi’s (a brand including the correct apostrophe)
✅ Dreamforce (an event)
✅ Jensen Huang (a person)
Avoid misspellings, Key Messages, Quotes or Backlinks!
❌ Levis (a brand without the correct apostrophe)
❌ Sales of hot sauces grew by 30% last year (Key Message)
❌ "This is a unique collaboration between two brands and we are delighted with the results" (Spokesperson Quote)
❌ www.example.com (Backlink)
If you have any questions about how to use Brand Keywords correctly, drop us a line at support@releasd.com!
Adding Brand Keywords to a chart:
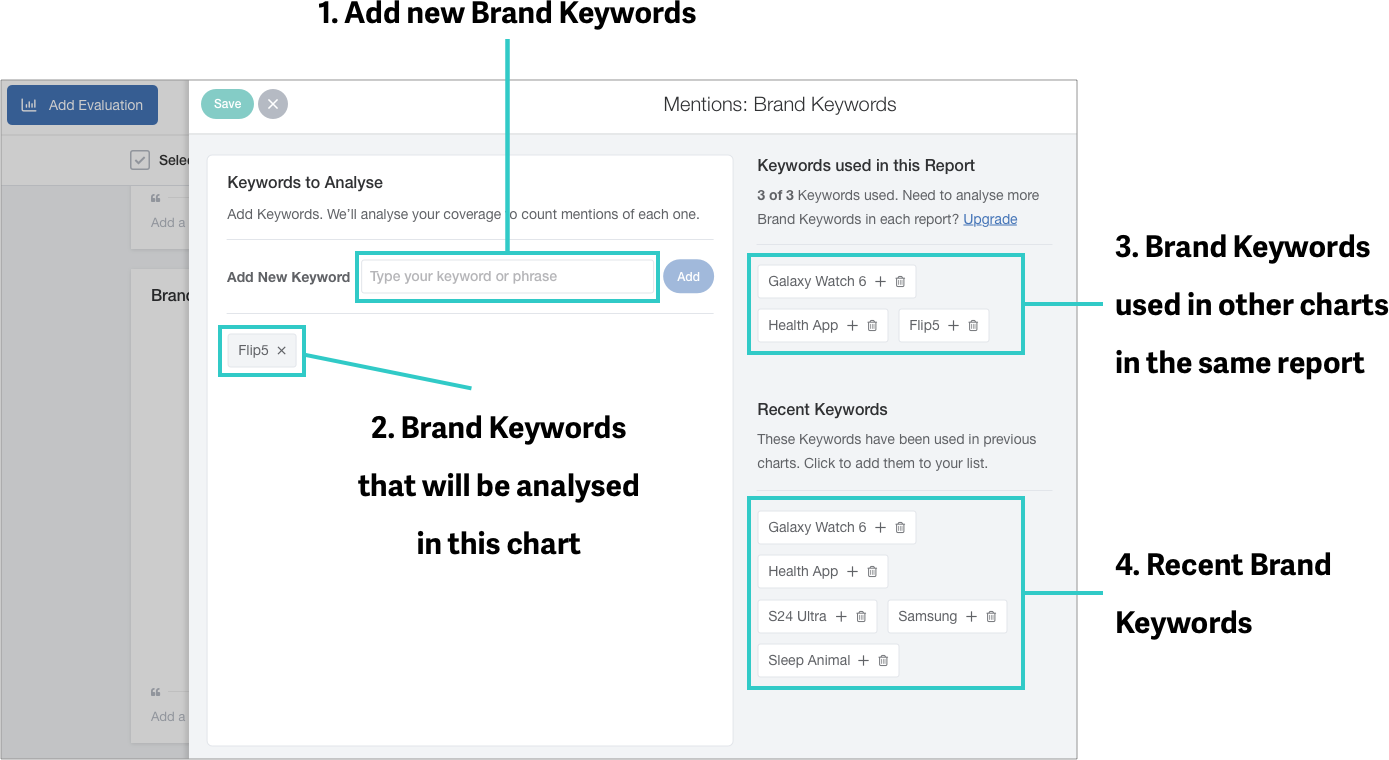
New Brand Keywords can be added here
Brand Keywords that have been selected for analysis in this chart will appear here
Brand Keywords that have been selected in other charts in this report are shown here.
Note: When Brand Keywords are added to any chart in a report, they count towards the quota that can be analysed in a single report - and are displayed here. If you have reached your quota, you will see a warning and can either delete a Brand Keyword, or upgradeRecently analysed Brand Keywords are displayed here
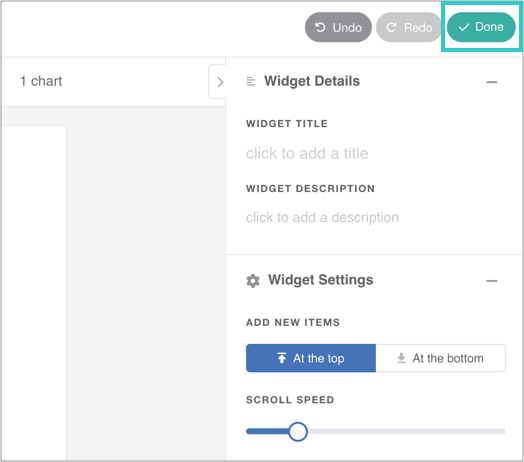
vi) Optional: edit or reorder the chart - or add a caption
vii) Finally, click 'Done' to save the widget
The chart will automatically update as you add online coverage to the report.