Welcome to the Perception deep dive article. Below, we cover:
Perception Overview & Use Cases
How we Measure Perception
How to add a Perception Chart (Evaluation Widget)
1. Perception Overview & Use Cases
Perception enables PRs to get impartial, on-demand reputation analysis without the need for expensive focus groups or time-consuming surveys.
Our system is trained to evaluate the online coverage you add to a report from the perspective of an unbiased reader with no prior knowledge of the entity being promoted.
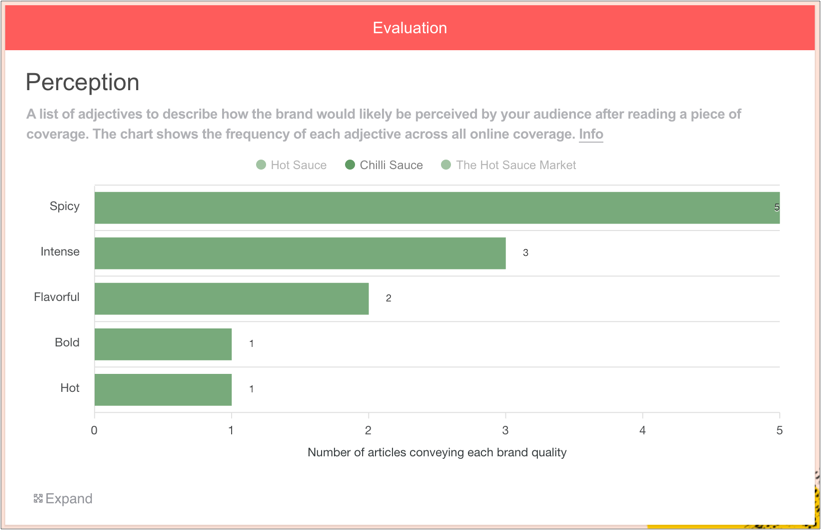
Based on the Brand Keywords you choose, it identifies five adjectives that best describe likely reader Perception, ranked by strength.
Why Perception is useful
PRs use Perception to:
Set objectives in terms of expected or desired Perception in the market
Benchmark a brand's reputation at the start of a campaign
Measure continuously as coverage is generated
Prove that PR / media coverage is able to shift audience Perception
Take action if Perception does not align with expectations
Compare the performance of different Brand Keywords side-by-side
Make more informed decisions about story development and placement going forward
2. How we Measure Perception
The process of detecting Perception works as follows:
Online coverage is added to a Releasd report; you add one or more Brand Keywords
Our AI system assigns five adjectives to each Brand Keyword based on the coverage in which it appears, and rank them by strength (it's trained to be unbiased and have no preconceptions - ie. it's purely based on the online coverage you add to a report)
Perception plotted on a bar chart
3. How to add a Perception Chart (Evaluation Widget)
i) First, add some Online Coverage to your report
Drag on the Online Coverage widget and enter some URLs.
You can learn how to do this here.
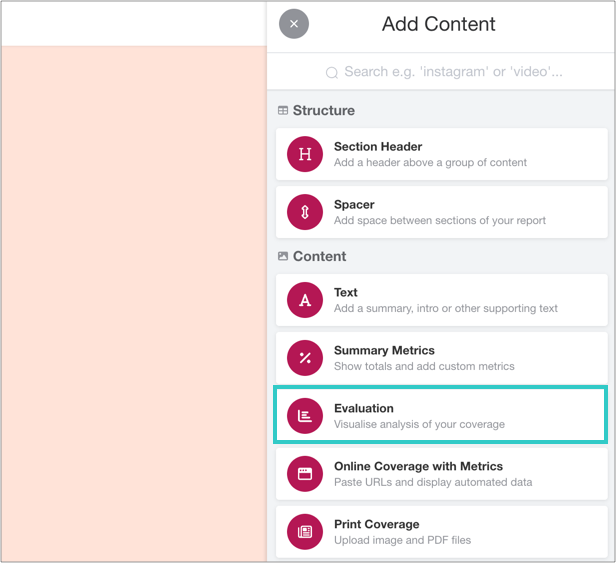
ii) Add an Evaluation widget to your report
You can find this in the Toolbar.
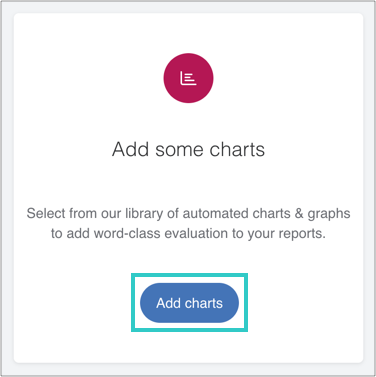
iii) Click 'Add Evaluation'
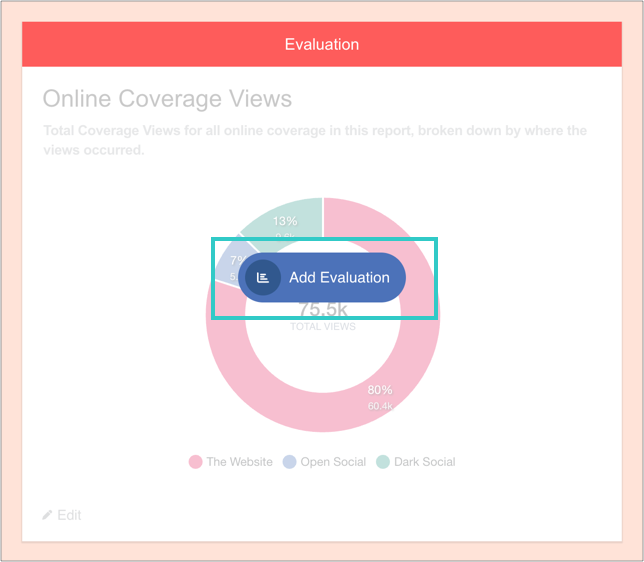
And then 'Add charts':
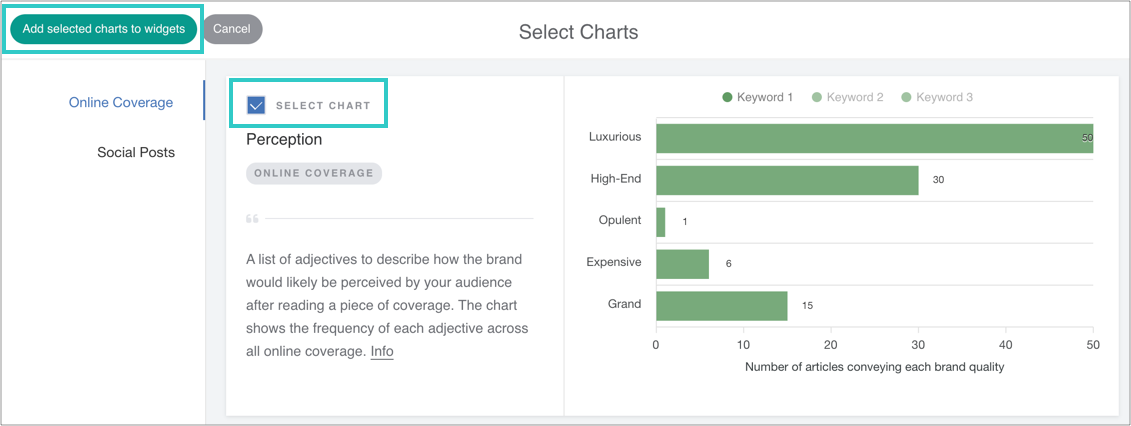
iv) Select the chart, and then add it to the widget
v) Manage Brand Keywords
A Brand Keyword in this context refers to the specific entity that has been promoted through PR - such as a company, campaign, product, service, person or event.
It's what you expect to appear in your media coverage, and what will be evaluated in your report.
Brand Keywords must be spelled accurately, but are not case sensitive.
Examples of Brand Keywords:
✅ Adobe Acrobat or adobe acrobat (a product, using upper or lower case letters)
✅ Levi’s (a brand including the correct apostrophe)
✅ Dreamforce (an event)
✅ Jensen Huang (a person)
Avoid misspellings, Key Messages, Quotes or Backlinks!
❌ Levis (a brand without the correct apostrophe)
❌ Sales of hot sauces grew by 30% last year (Key Message)
❌ "This is a unique collaboration between two brands and we are delighted with the results" (Spokesperson Quote)
❌ www.example.com (Backlink)
If you have any questions about how to use Brand Keywords correctly, drop us a line at support@releasd.com!
Adding Brand Keywords to a chart:
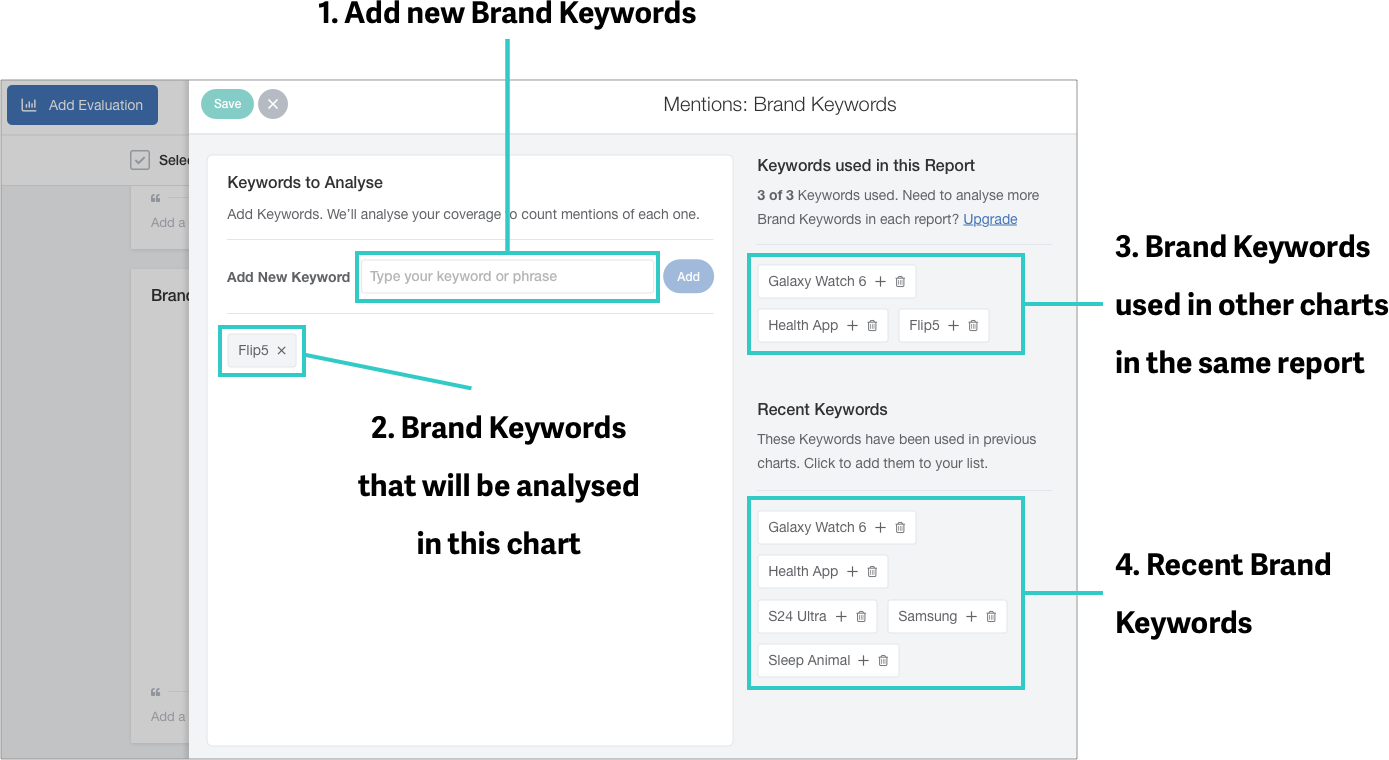
New Brand Keywords can be added here
Brand Keywords that have been selected for analysis in this chart will appear here
Brand Keywords that have been selected in other charts in this report are shown here.
Note: When Brand Keywords are added to any chart in a report, they count towards the quota that can be analysed in a single report - and are displayed here. If you have reached your quota, you will see a warning and can either delete a Brand Keyword, or upgradeRecently analysed Brand Keywords are displayed here
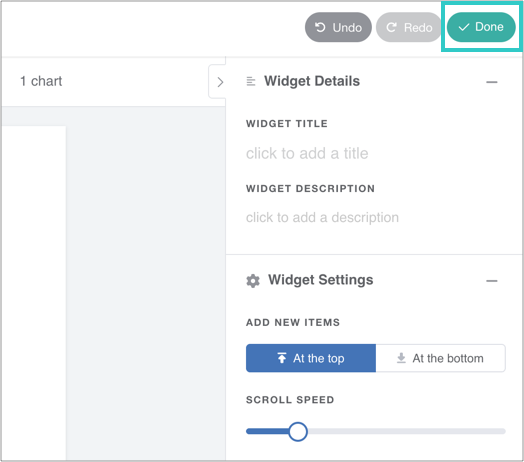
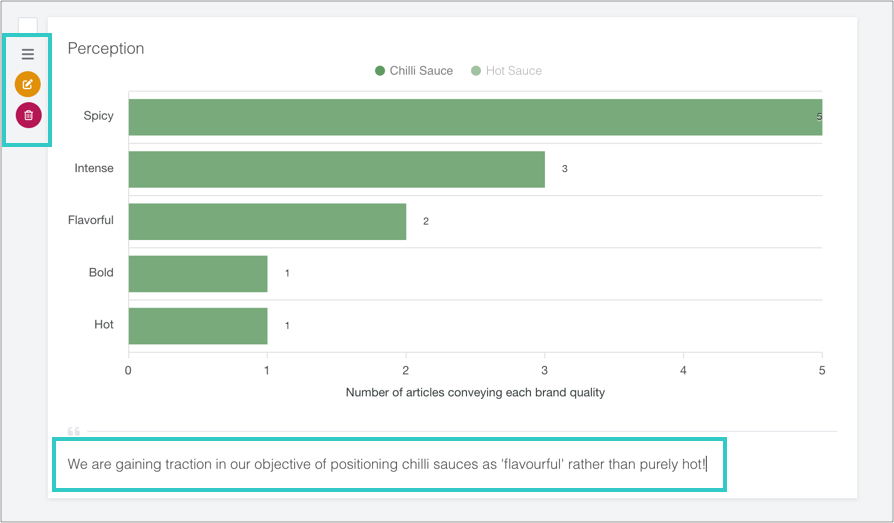
vi) Optional: add a caption, reorder or delete the chart
vii) Finally, click 'Done' to save the widget
The chart will automatically update as you add online coverage to the report.