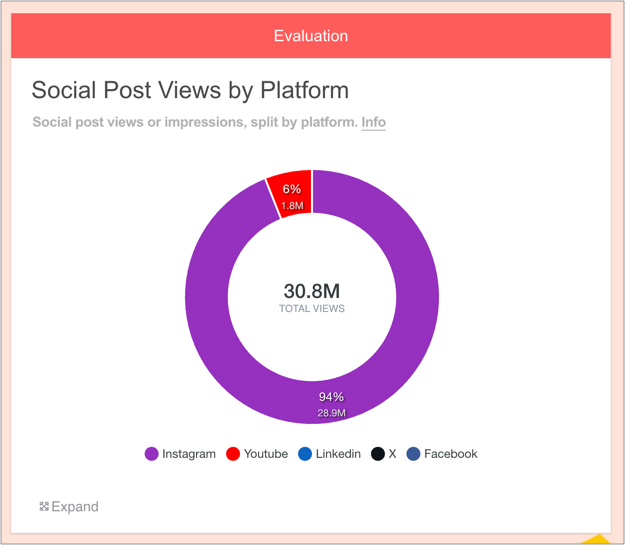
The Social Post Views by Platform chart can be accessed via the Evaluation widget.
Why it's useful
PRs can use this chart to:
Learn which platforms yielded the most views, at a glance
Once identified, explore specific posts within the Social Posts widget that contributed the most
Make more informed decisions about content creation and distribution going forward
How to add this chart
1. First, add some Social Posts to your report
Drag on the Social Posts widget and enter some URLs.
You can learn how to do this here.
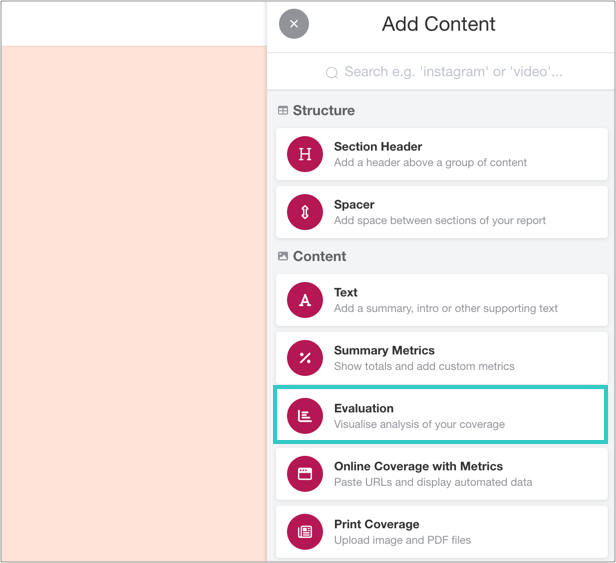
2. Add an Evaluation widget to your report
You can find this in the Toolbar.
3. Click 'Add Evaluation'
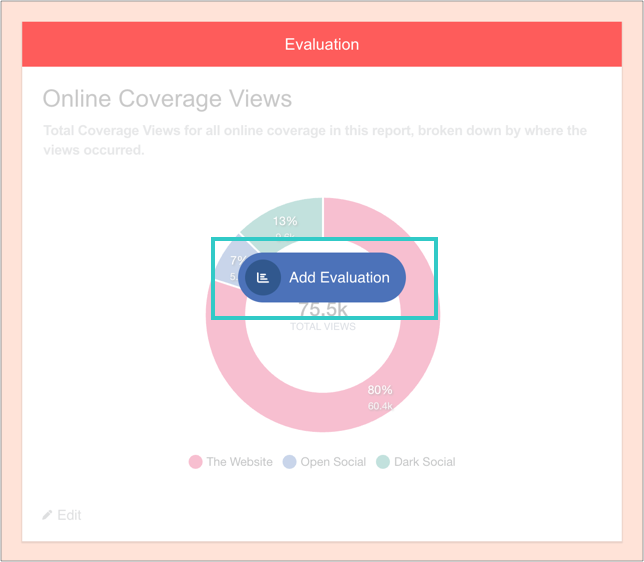
And then 'Add charts':

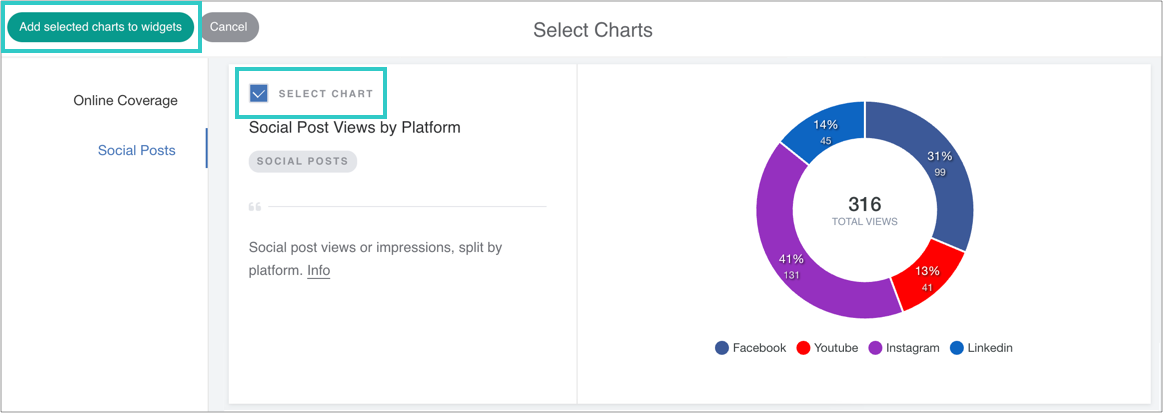
4. Select the chart, and then add it to the widget
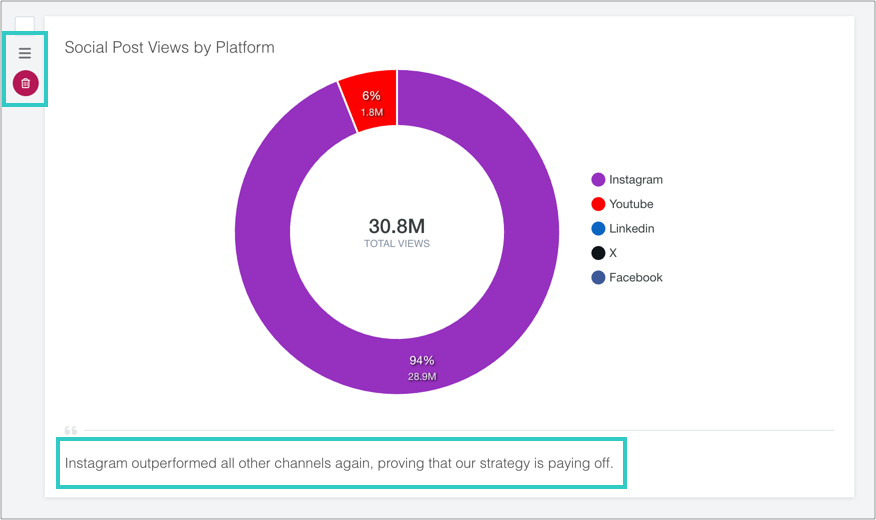
5. Optional: add a caption, reorder or delete the chart
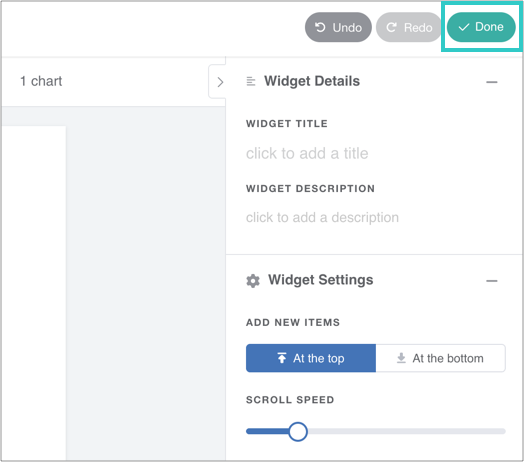
6. Finally, click 'Done' to save the widget
The chart will automatically update as you add online coverage to the report.