Releasd provides a range of automated and semi-automated PR and social media metrics.
Here's a comprehensive list of what's currently available in the platform.
We'll cover:
Online Coverage Widget
Social Posts Widget
Print Coverage Widget
Evaluation Widget
Summary Metrics Widget
1. Online Coverage Widget
Add links to this widget to display online articles with associated metrics. Learn more.
For each piece of coverage, the widget will automatically fetch:
Monthly Website Visits (Reach)
How many times the publishing website has been visited in a month (ie total page loads for that site)
Monthly Website Unique Visitors (UV)
How many unique individuals have visited the publishing website in a month (will therefore be a lower figure than Reach)
Website Domain Authority
A score (0-100) that predicts how well a website will rank on search engine results pages
B2B campaigns may lean towards lower scores as they tend to target smaller, niche sites
Website Average Visit Duration
The average visit time for a website: a good indicator of quality
Website Popularity over Time
The Reach figure plotted over the past three months, showing general traffic trends
Total Coverage Views
The number of times the specific article will have been seen, both on the publishing website and in social feeds
Often much lower than website Reach or UV figures, but more realistic
Learn about the methodology for Coverage Views here
Coverage Views from the Website
The number of times the specific article will have been seen on the publishing website
Coverage Views on Open Social
The number of times the specific article will have been seen on Facebook, X, Reddit and Pinterest which have APIs and are therefore 'Open'
Learn more about Open/Dark social here
Coverage Views on Dark Social
The number of times the specific article will have been seen on LinkedIn, WhatsApp and all other platforms which do not have APIs and are therefore 'Dark'.
Learn more about Open/Dark social here
Total Social Engagements
How many Engagements the article received on social media channels
This only populates if the article has been shared in the first place
Learn about how we detect Shares and Engagements here
Facebook Engagements / Reactions
How many Engagements the article received on Facebook, including Reactions (Love, Wow, Angry etc) which are a good proxy for Sentiment
X Engagements
How many Engagements the article received on X
Pinterest Engagements
How many Engagements the article received on Pinterest
Dark Social Engagements
How many Engagements the article received on Dark Social channels
Learn more about Open/Dark social here
2. Social Posts Widget
Add links to this widget to display live social posts. Learn more.
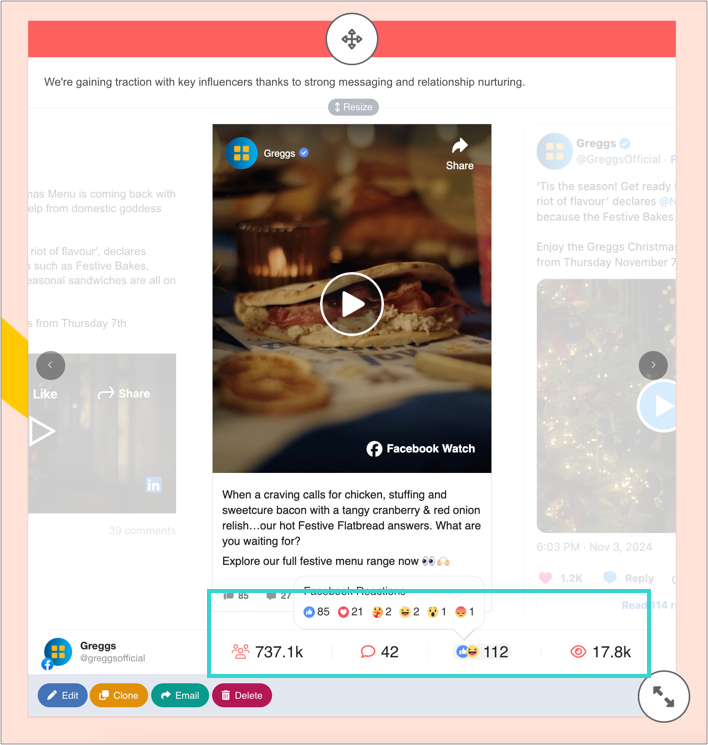
For each social post added, the widget will automatically fetch the metrics below.
Users can upload screenshots or video clips for Stories and add metrics manually.
Followers
Comments
Likes
Views
YouTube
Subscribers
Comments
Likes
Views
Followers
Comments
Shares
Likes
Reactions
Views
Followers
Likes
Comments
Reposts
TikTok
Followers
Comments
Diggs
Shares
Plays
X
Followers
Replies
Reposts
Likes
Views
3. Print Coverage Widget
Upload PDFs or images to this widget to display print articles. Learn more.
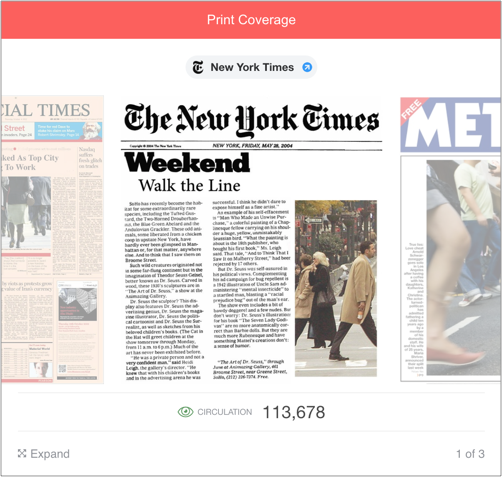
For each piece of coverage, the widget will display:
Circulation
Manually entered, then saved to account database for easy re-use
4. Evaluation Widget
Create charts and graphs that prove the impact of your PR results. Learn more.
Online Coverage
Online Coverage Views by Source
Show the source of online coverage views: website, open social, or dark social. Learn more about Open/Dark social here
Online Coverage Over Time
Show online coverage in a timeline chart to spot key moments a glance. Learn more
Domain Authority
Visualise online coverage grouped by the Domain Authority of the publishing site. Learn more
Social Engagement of Online Coverage
Show Social Engagements of online coverage, broken down by platform, to prove that your story made an impact. Learn more
Facebook Reactions of Online Coverage
Show social sentiment with a breakdown of user Reactions to all online coverage that was shared to Facebook. Learn more
Mentions
Show the number of times a Brand Keyword appeared across online coverage. Learn more
Prominence
Track the first mention: headline, top, middle or bottom of an article. Learn more
Sentiment
Measure the tone of specific Brand Keywords within coverage. Learn more
Perception
Get on-demand reputation analysis - no need for costly surveys or focus groups. Learn more
Recall
Show the likelihood that your brands will be remembered after reading coverage. Learn more
Key Message Penetration
Prove that a your most important points have been successfully communicated. Learn more
Spokesperson Quote Inclusion
Track appearances of spokesperson quotes across all online coverage, even if the quotes are split within an article. Learn more
Social Media
Social Posts by Platform
Show social posts split by the platform on which they appeared. Learn more
Social Posts Over Time
Show the number of Social Posts that were published, by date. Learn more
Social Post Views by Platform
Show views of Social Posts, split by channel. Learn more
Social Post Reach by Platform
Show the followers of all social post authors, split by platform. Learn more
Social Post Comments by Platform
Show Comments on Social Posts, split by channel. Learn more
Social Post Shares by Platform
Show Shares of Social Posts, split by channel. Learn more
Social Post Likes by Platform
Show Likes of Social Posts, split by the source platform. Learn more
5. Summary Metrics Widget
This widget displays totals of online, social and print coverage within a report. Learn more.
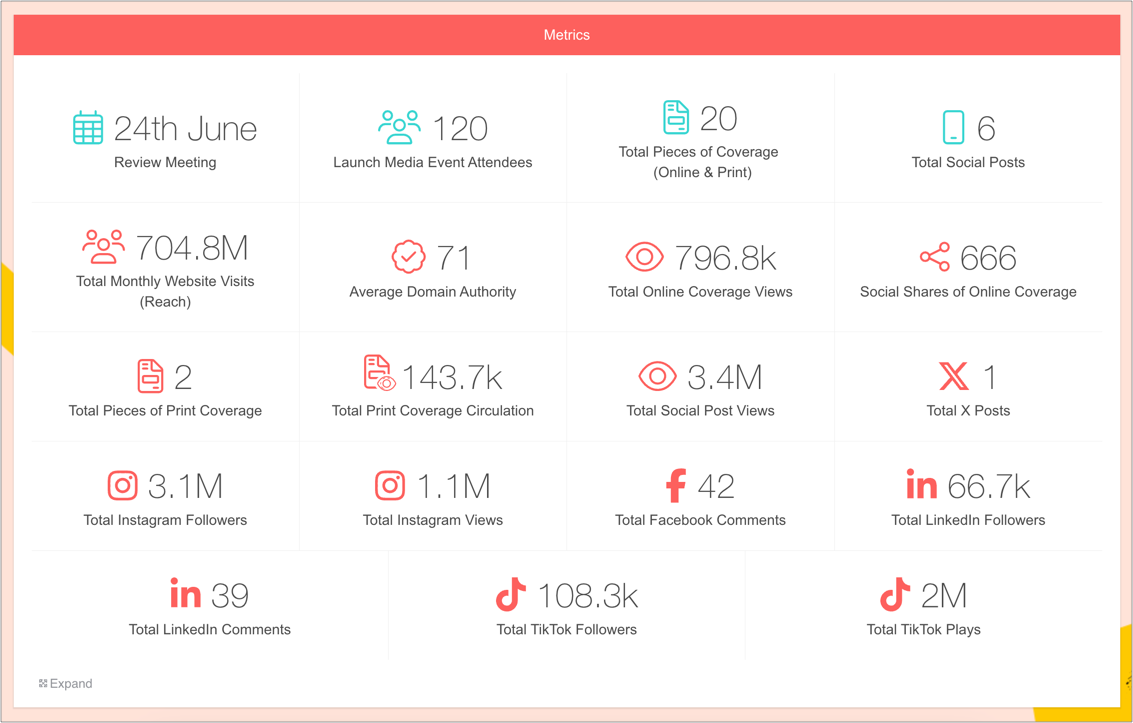
Overall Totals
Total Pieces of Coverage (Online & Print)
Adds up all of the online and print coverage added to a report
Total Pieces of Online Coverage
Adds up all of the online coverage added to a report
Total Pieces of Print Coverage
Adds up all of the print coverage added to a report
Total Social Posts
Adds up all of the social posts added to a report
Online Coverage
Total Pieces of Online Coverage
Adds up all of the online coverage added to a report
Total Monthly Website Visits (Reach)
How many times all of the publishing websites in a report have been visited in a month (ie total page loads for those sites)
Total Monthly Unique Website Visitors
How many unique individuals have visited all publishing websites in a report in a month (will therefore be a lower figure than Total Monthly Website Visits (Reach))
Average Domain Authority
DA is a score (0-100) that predicts how well a website will rank on search engine results pages; this metric averages DA for publishing websites across the whole report
Total Online Coverage Views
The combined number of times all articles within a report will have been seen, both on websites and in social feeds
Learn about the methodology for Coverage Views here
Online Coverage Views on Websites
The total number of times all articles in a report will have been seen on the original publishing websites
Online Coverage Views on Social
The total number of times all articles in a report will have been seen in Open and Dark social platform feeds
Learn more about Open/Dark social here
Online Coverage Views on Open Social
The total number of times all articles in a report will have been seen in Open social platform feeds
Learn more about Open/Dark social here
Online Coverage Views on Dark Social
The total number of times all articles in a report will have been seen in Dark social platform feeds
Learn more about Open/Dark social here
Social Engagements of Online Coverage
The total number of social engagements received by all coverage in a report (if shared)
Social Shares of Online Coverage
The total number of times all coverage in a report was shared
Open Social Shares of Online Coverage
The total number of times all coverage in a report was shared to Open social platforms
Learn more about Open/Dark social here
Dark Social Shares of Online Coverage
The total number of times all coverage in a report was shared to Dark social platforms
Learn more about Open/Dark social here
Facebook Shares of Online Coverage
The total number of times all coverage in a report was shared to Facebook
Facebook Likes of Online Coverage
The total number of times all coverage in a report was Liked on Facebook
Facebook Comments of Online Coverage
The total number of times all coverage in a report was commented on on Facebook
Facebook Reactions of Online Coverage
The total number of times all coverage in a report was Reacted to on Facebook
X Shares of Online Coverage
The total number of times all coverage in a report was shared to X
Pinterest Shares of Online Coverage
The total number of times all coverage in a report was shared to Pinterest
Recall
The combined Recall score for all coverage added to a report, both overall and for specific Keywords. Learn more
Mentions
Total Mentions detected in all coverage added to a report, both overall and for specific Keywords. Learn more
Sentiment
The average Sentiment both overall and for specific Keywords. Learn more
Key Message Penetration
The total Key Message Penetration for all coverage added to a report
For example, if two Key Messages were tracked, and each one appeared in half of the coverage, the total would be 100% (ie all coverage included at least one Key Message)
Spokesperson Quote Inclusion
The total Spokesperson Quote Inclusion for all coverage added to a report
For example, if two Spokesperson Quotes were tracked, and each one appeared in half of the coverage, the total would be 100% (ie all coverage included at least one Spokesperson Quote)
Attention Earned
The total number of hours of focused attention earned by all coverage in a report
Learn more about Attention measurement
Attention Cost Estimate (ACE) £/$/€
The media spend required to purchase ads that would receive the same amount of attention that was earned via PR
Learn more about Attention measurement
Print Coverage
Total Pieces of Print Coverage
Adds up all of the print coverage added to a report
Total Print Coverage Circulation
Adds up the circulations of all print coverage added to a report
Social Posts
Total Social Posts
Total Social Post Views
Total Social Post Followers
Total Social Post Likes
Total Social Post Comments
Total Social Post Shares
Total Instagram Posts
Total Instagram Followers
Total Instagram Comments
Total Instagram Likes
Total Instagram Views
Total YouTube Posts
Total YouTube Subscribers
Total YouTube Comments
Total YouTube Likes
Total YouTube Views
Total Facebook Posts
Total Facebook Followers
Total Facebook Comments
Total Facebook Shares
Total Facebook Likes
Total Facebook Reactions
Total Facebook Views
Total LinkedIn Posts
Total LinkedIn Followers
Total LinkedIn Likes
Total LinkedIn Comments
Total LinkedIn Reposts
Total TikTok Posts
Total TikTok Followers
Total TikTok Comments
Total TikTok Diggs
Total TikTok Shares
Total TikTok Plays
Total X Posts
Total X Followers
Total X Replies
Total X Reposts
Total X Likes
Total X Views