Welcome to the Backlinks deep dive article. Below, we cover:
Backlinks Overview & Use Cases
How we Measure Backlinks
How to add a Backlinks Chart (Evaluation Widget)
How to add Total Backlinks (Summary Metrics Widget)
1. Backlinks Overview & Use Cases
Backlinks are hyperlinks placed within editorial content that direct readers to a brand’s website or another relevant page. In addition to driving valuable traffic, they can boost a site’s search engine visibility - since most search engines view backlinks as signals of credibility and authority.
So why aren’t backlinks included in every media story?
Because getting one is harder than it sounds! Journalists may be happy to cover a story, but that doesn’t mean they’ll link to a commercial website. Many writers draw a firm line between reporting on a topic and actively promoting it.
Why Backlink tracking is useful
PRs use Backlink tracking to:
Prove that they have delivered a clear call to action within media coverage
Demonstrate the ability of PR to impact SEO
Show that they have strong relationships with the media
2. How we Measure Backlinks
The process of analysing Backlinks works as follows:
Online coverage is added to a Releasd report
Users add one or more target Backlinks to the Evaluation widget
Our system scans each article and seeks those Backlinks
Note: even if they backlink first points to an affiliate or third party website and then redirects to your desired website, Releasd will still detect the Backlink successfully
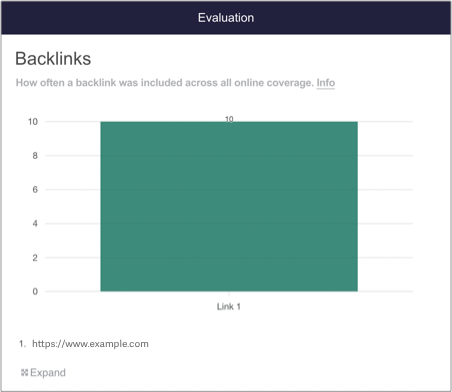
3. How to add a Backlinks Chart (Evaluation Widget)
i) First, add some Online Coverage to your report
Drag on the Online Coverage widget and enter some URLs.
You can learn how to do this here.
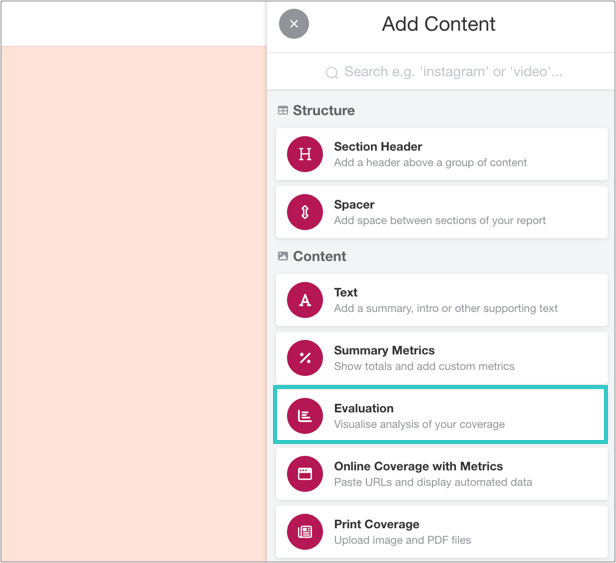
ii) Add an Evaluation widget to your report
You can find this in the Toolbar.
iii) Click 'Add Evaluation'
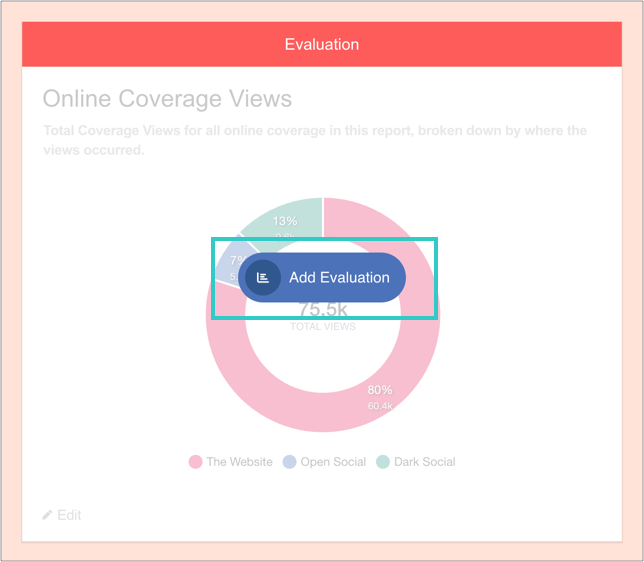
And then 'Add charts':
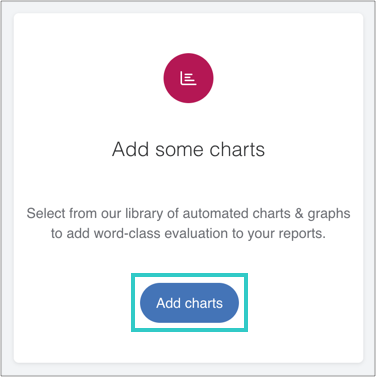
iv) Select the Backlinks chart, and then add it to the widget
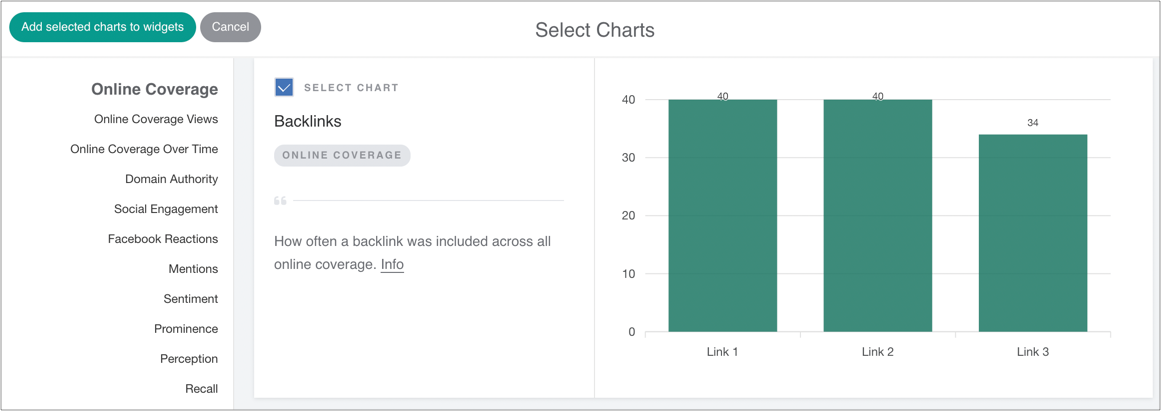
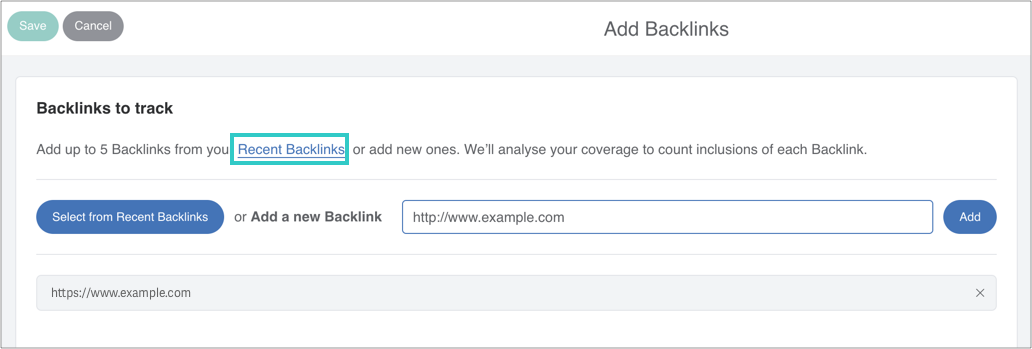
v) Managing Backlinks
Simply add your Backlink (e.g. https://example.com) as shown, or select from recently used options.
You can add up to five in the same chart.
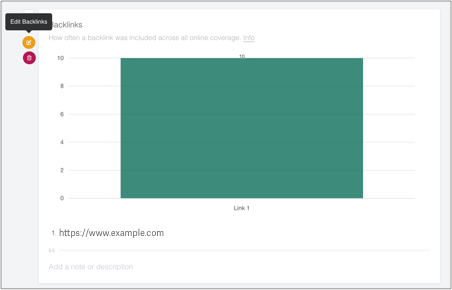
vi) Optional: edit or reorder the chart - or add a caption
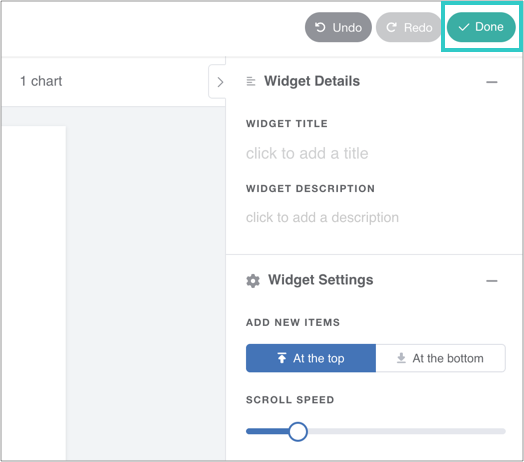
vii) Finally, click 'Done' to save the widget
The chart will automatically update as you add online coverage to the report.
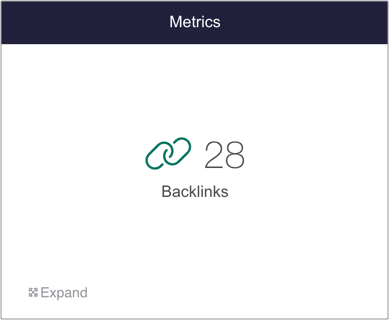
4. How to add Backlinks Total Metrics (Summary Metrics Widget)
The Summary Metrics widget displays total figures in a visual infographic.
i) Add a Summary Metrics widget to your report
You can find this in the Toolbar.
Click to open the widget and add metrics.
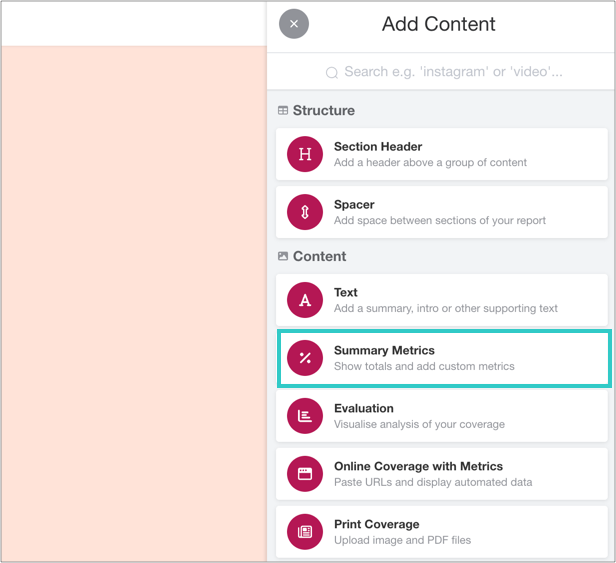
ii) Scroll to the Online Coverage section
Select the Backlinks tile.
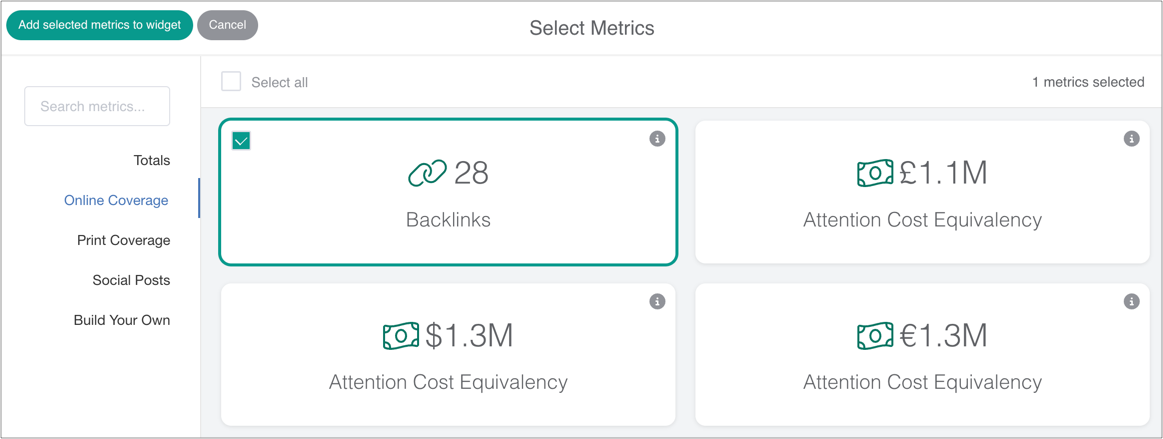
iii) Save the widget
Once added, click to save the widget. Metrics will automatically update alongside evaluation.