

Releasd: AI measurement done differently
Most GEO reporting platforms are built for marketers looking to answer a question like this:
How is my brand performing in AI responses?
The starting point is the category in which the brand sits. Much of the resulting data is not relevant to PR teams and the coverage they have generated.
Releasd is built exclusively for public relations professionals asking a question like this:
How is my earned media coverage influencing AI responses?
Since PRs add their accurate coverage to Releasd reports, we are uniquely placed to provide much more relevant and useful data: proving the value of modern PR and helping with generative engine optimisation (GEO).
See an example of Releasd's integrated earned media AI measurement.
Releasd CEO Richard Benson discusses the difference between general GEO tools and integrated earned media AI measurement.
Methodology
Accurate online coverage URLs are first added to a Releasd report (via the Online Coverage widget) by the user.
Here's what happens next:
Article copy is fetched automatically
Releasd uses AI to understand the key themes of the coverage
Based on these themes, Releasd automatically generates an extensive list of 'Non-Branded' and 'Branded' prompts that relate to the story
Using these relevant prompts, each article is graded based on how well it lends itself to being used in AI responses. We measure two factors: Quality and Accessibility
An overall AI Impact score is then calculated, both on an article-level and overall report-level
Through this automated process, PR teams can measure the likely impact of their coverage from an AI perspective, and adopt appropriate strategies going forward.
Key term definitions
Some of the terms used in this article may be new to PR practitioners. Definitions can be found below.
Branded vs Non-Branded Prompts:
These tend to represent two key stages of the audience journey.
Non-Branded prompts do not include the brand name. For example, "What are the most popular cruises in Norway?". Often used by people using AI tools to do early research.
Branded prompts do include the brand name. For example,"Is the Hurtigruten cruise a good way to see the Norwegian fjords?". Often used by people who are already aware of the brand/event/activity in question and are doing deeper research.
Some articles lend themselves to one stage more than the other and Releasd can measure this, providing an interesting data point for impact analysis and GEO.
Quality Score:
A genuine editorial article which is highly relevant to a given prompt is more likely to influence AI responses than one that is less specific and appears in a publication with low authority in its field.
Releasd grades each article from 0 to 100 based on the following Quality factors:
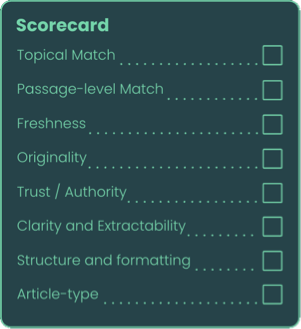
Topical match (overall focus)
Passage-level match (specific segment focus)
Freshness (how up-to-date the content is)
Originality (e.g. unique editorial content vs pasted press release)
Trust / authority (niche publications can still outweigh mainstream outlets based on the nature and audience of the story)
Clarity and extractability (AI readability)
Article type (feature, list, op-ed)
Accessibility Score:
Some publications permit all AI bots to access their content. Some block them all. Others allow certain bots, but not others.
Releasd can detect this automatically, and each article is graded from 0 (all bots blocked) to 100 (all bots allowed).
AI Impact Score:
This is calculated based on the Quality and Accessibility scores.
If Quality Score is 100 and Accessibility Score is 100, then AI Impact Score will be 100
If Quality Score is 100 and Accessibility Score is 0, then AI Impact Score will be 0 because the article cannot be seen by AI bots
If Quality Score is 50 and Accessibility is 50, then AI Impact Score will be 25 because the lack of total Accessibility decreases the impact that the article can have
GEO:
Generative engine optimisation. In the context of public relations, this refers to the process of increasing the influence that media coverage can have on relevant AI responses.
How to measure earned media AI influence in Releasd
PR teams can select from a range of integrated analytics that demonstrate the impact of their earned media coverage and provide insights for GEO.
See an example of Releasd's integrated earned media AI measurement.
AI Impact: Coverage Analysis
This key chart shows all coverage in a report, graded by AI Impact, Quality and Accessibility.
It also provides a rationale for each article's performance.
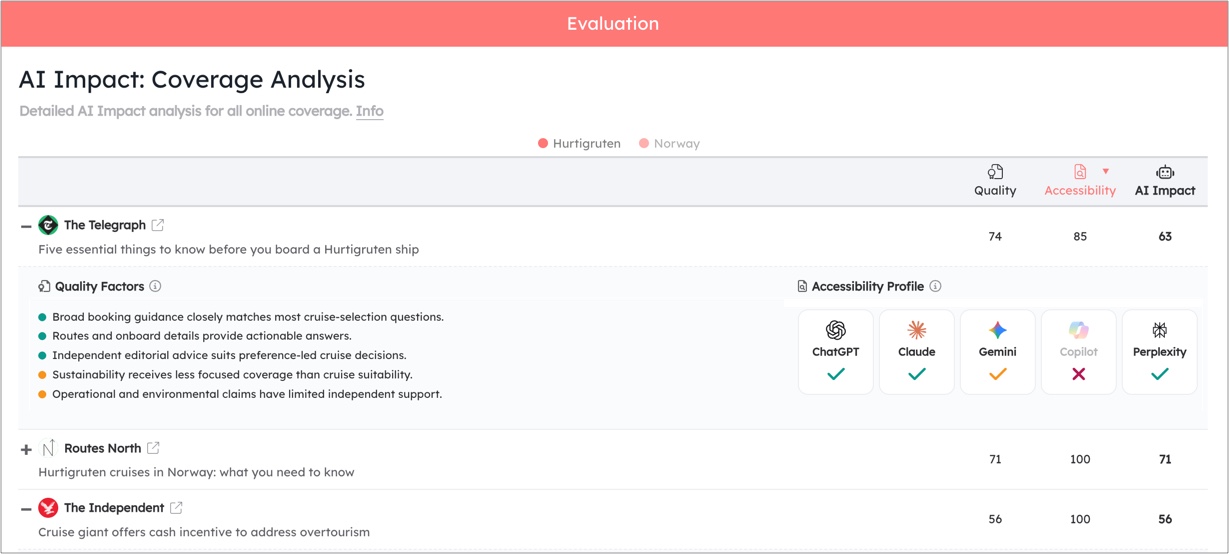
Quality factors:
🟢 positive factor in terms of likely impact on AI responses, for example "Firsthand experiences provide substantial answers to travel-related prompts."
🟠 neutral factor in terms of likely impact on AI responses, for example "Suitability claims have limited independent supporting evidence."
🔴 negative factor in terms of likely impact on AI responses, for example "Article lacks meaningful mentions of the brand."
Accessibility factors:
User can also see which bots can access the publication in question.
Releasd can detect bot access for ChatGPT, Claude, Gemini, Copilot and Perplexity.
Green tick = all bots for that AI service can access the publication
Orange tick = some bots for that AI service can access the publication
Red cross = no bots for that AI service can access the publication
These provide context for PR teams looking to explain the reasoning behind the scoring and adapt their strategies accordingly.
The AI Impact: Coverage Analysis chart can be found in the Charts & Graphs widget.
Results can be broken down by different Brand Keywords (tabbed).
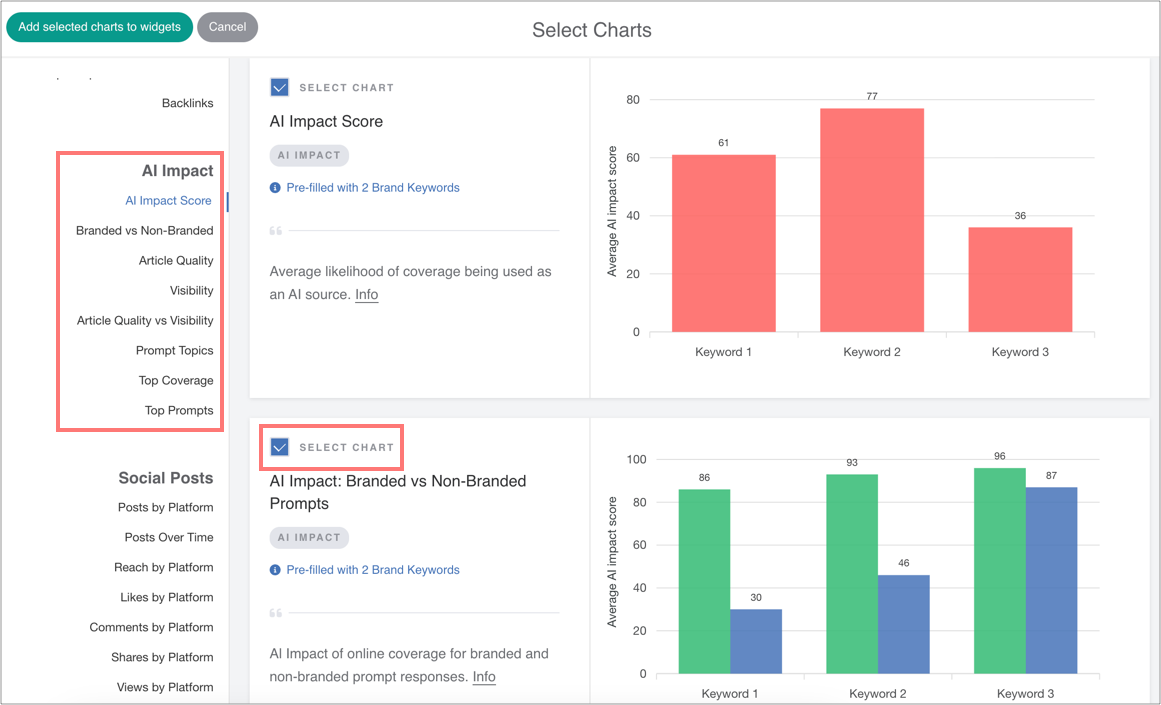
AI Impact Score
This grades all of the online coverage in a report in terms of how well it lends itself to influencing AI responses, from 0 to 100.
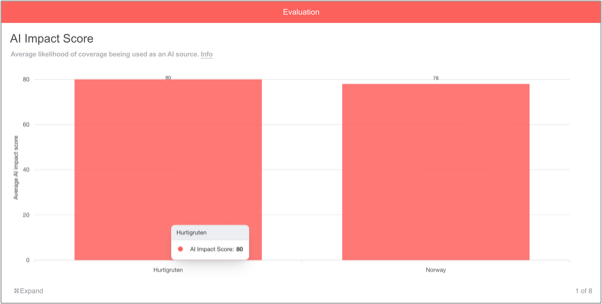
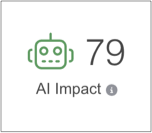
The score itself combines Quality (i.e. the relevance and readability of an article) and Accessibility (i.e. whether the coverage can actually be accessed by AI models - some publishers simply block them).
An article with high Accessibility and Quality will have a strong AI Impact Score
An article that is not accessible to any AI bots will have a score of 0, regardless of its Quality
The AI Impact Score chart can be found in the Charts & Graphs widget.
Different Brand Keywords can be analysed side-by-side.
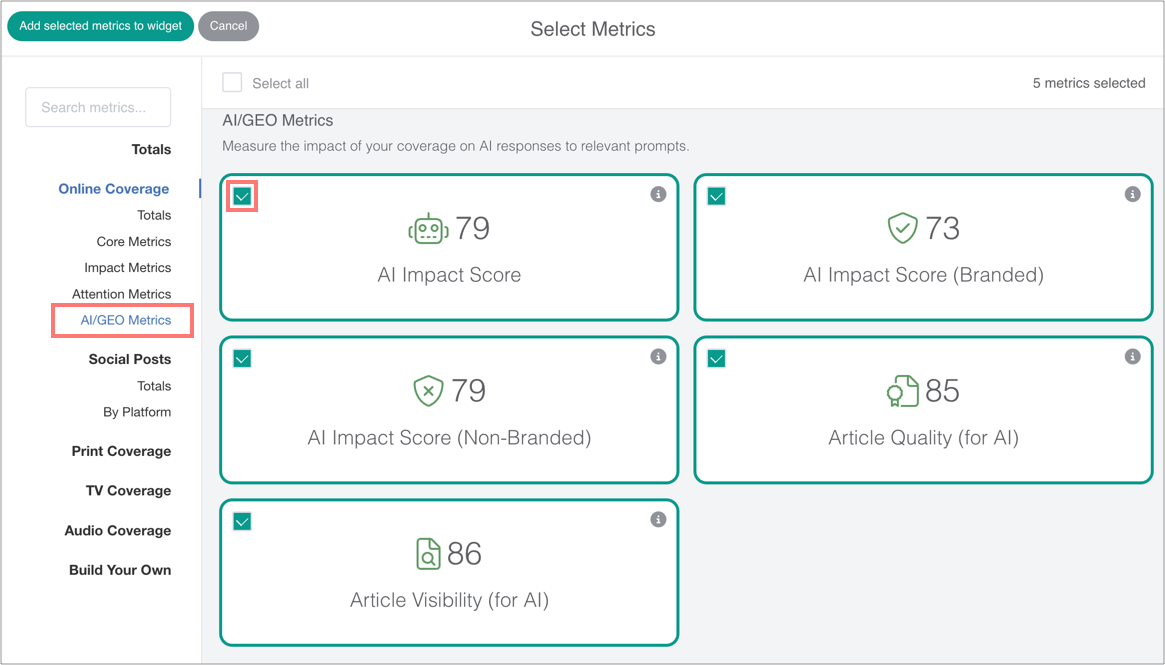
The AI Impact Score metric can be found in the Summary Metrics widget.
AI Impact: Top Prompts
The Releasd platform 'reads' all articles added to a report, then automatically generates a wide range of realistic prompts that are pertinent to the brand or story in question.
The AI Impact: Top Prompts table lists the prompts that are most likely to be influenced by the coverage in a report.
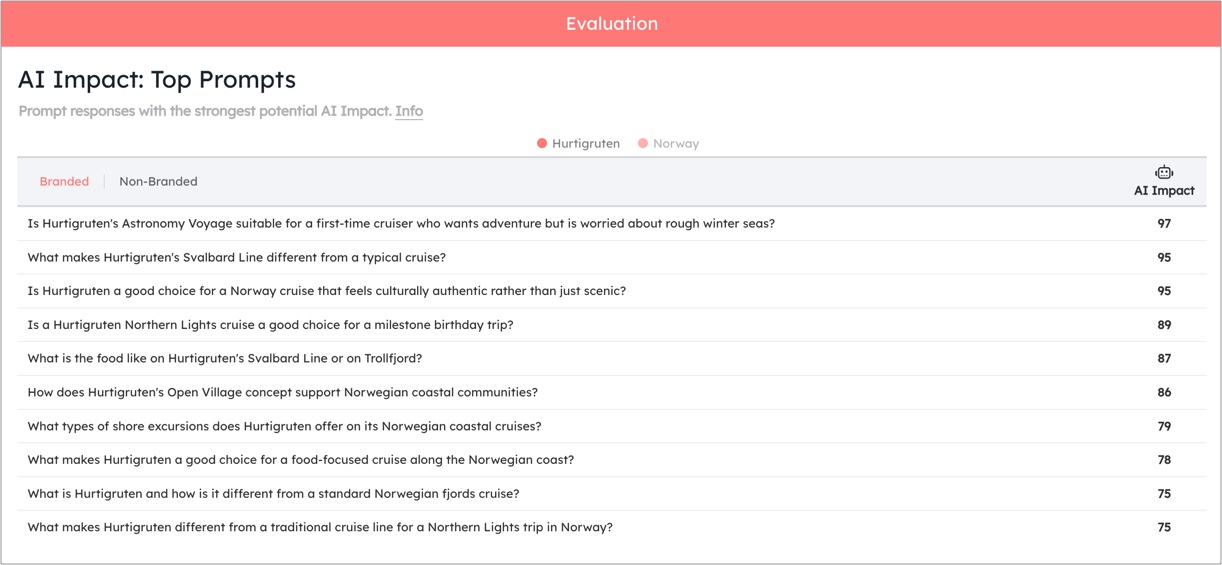
It can be found in the Charts & Graphs widget.
Results can be broken down by different Brand Keywords (tabbed).
AI Impact: Branded vs Non-Branded Prompts
This chart shows how well coverage in a report lends itself to influencing Non-Branded vs Branded prompts.
It helps PRs understand the AI impact of their coverage at two key stages of the audience journey - awareness and consideration respectively.
See above for definitions and examples.
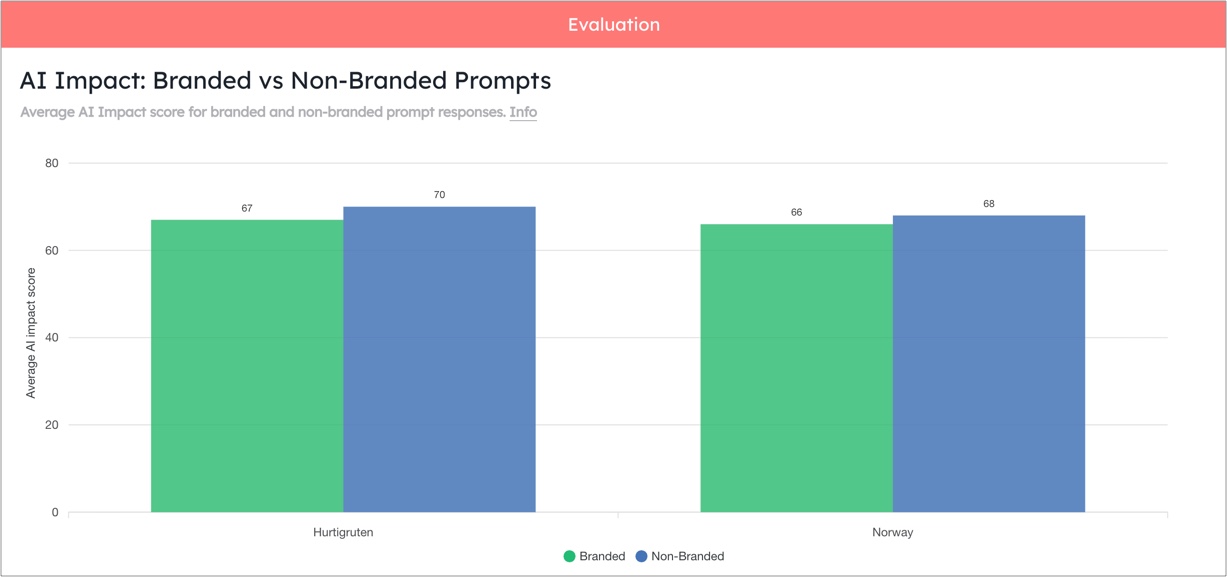
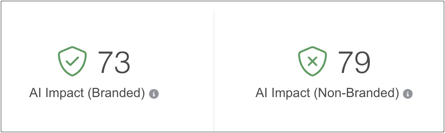
The AI Impact: Branded vs Non-Branded Prompts chart can be found in the Charts & Graphs widget.
Different Brand Keywords can be analysed side-by-side.
The AI Impact: Branded vs Non-Branded metrics can be found in the Summary Metrics widget.
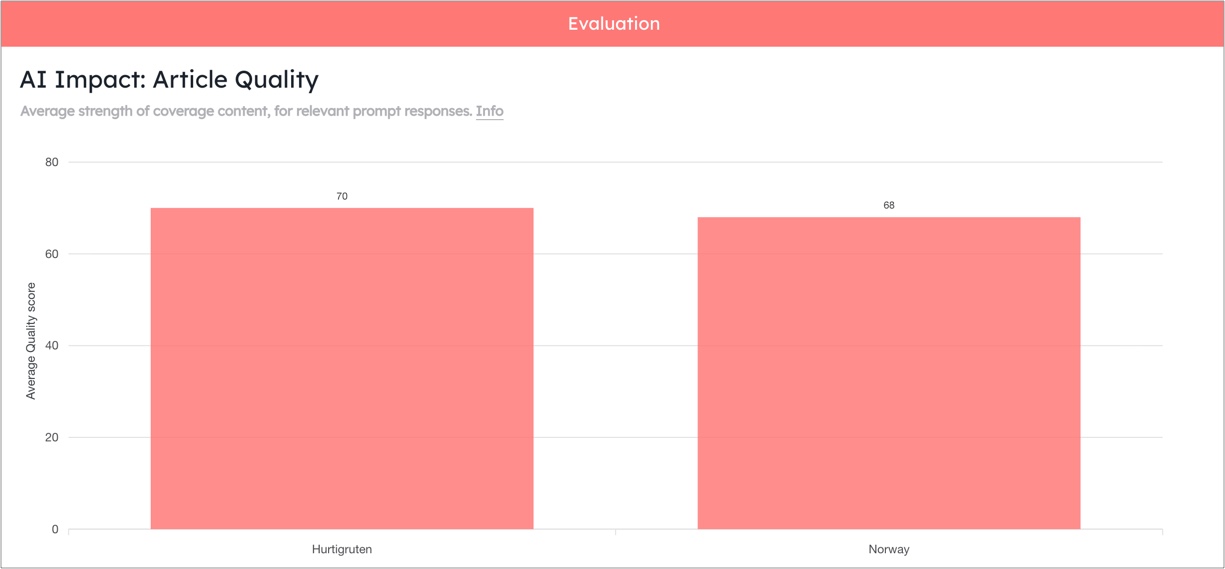
AI Impact: Article Quality
An article that includes clear information that precisely answers an AI user's prompt will be selected over one that is vague or irrelevant.
This is represented by the Article Quality Score.
See above for definitions and examples.
The AI Impact: Article Quality chart can be found in the Charts & Graphs widget.
Different Brand Keywords can be analysed side-by-side.
The AI Impact: Article Quality metric can be found in the Summary Metrics widget.
AI Impact: Article Accessibility
The impact of any given article on AI responses is affected by how easily it can be crawled by AI bots.
Some publishers are happy for their content to be used by AI models, while others are not. In some cases, certain AI bots are blocked but others are allowed.
The AI Impact: Article Accessibility chart shows the overall Accessibility for all online coverage in a report.
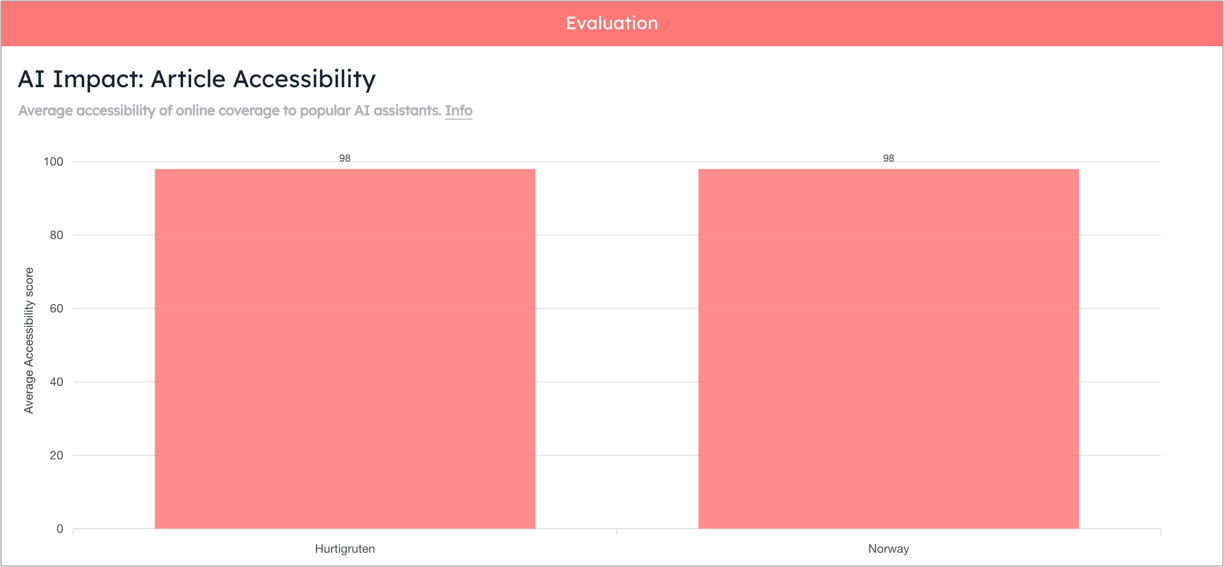
Accessibility is based on which bots are blocked, weighted by market share. For example, if Perplexity is blocked, it will have less impact on the score than if ChatGPT is blocked. Market share data is provided by Similarweb and updated on a monthly basis.
The AI Impact: Article Accessibility chart can be found in the Charts & Graphs widget.
Different Brand Keywords can be analysed side-by-side.
The AI Impact: Article Accessibility metric can be found in the Summary Metrics widget.
AI Impact: Article Quality vs Accessibility
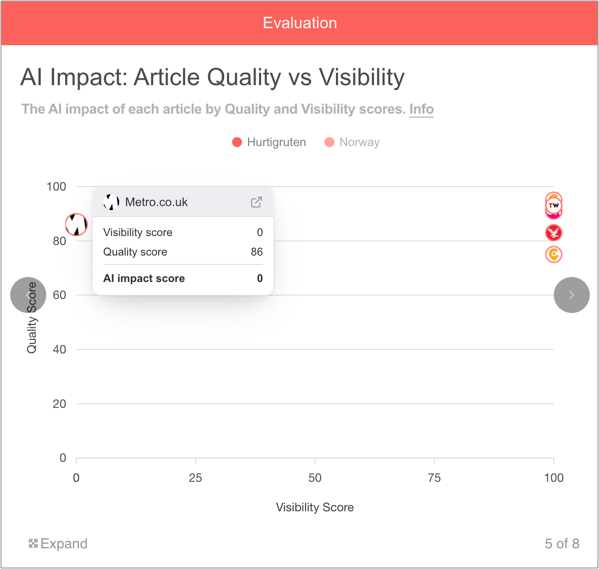
This chart shows Quality vs Accessibility at a glance to quickly determine high and low performers.
Icons can be clicked on to see further article and publisher details.
The AI Impact: Article Quality vs Accessibility chart can be found in the Charts & Graphs widget.
Results can be broken down by different Brand Keywords (tabbed).
How to add AI/GEO analytics to a Releasd report
AI/GEO measurement in Releasd is automated.
Please watch the short explainer video, or follow the steps below, to activate the analytics.
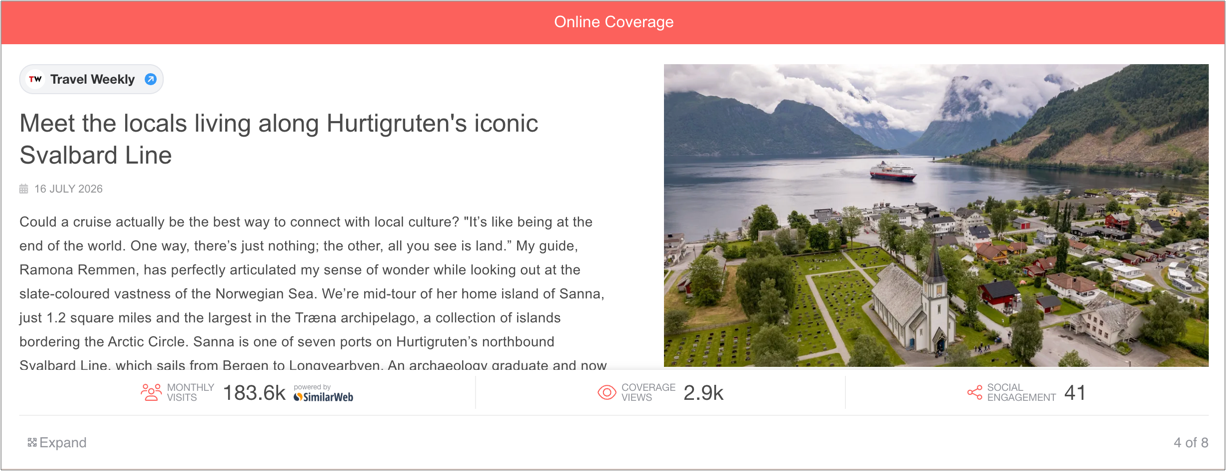
Add some online coverage to your report.
To do this, drag on the Online Coverage widget and paste your URLs
Drag on the Charts & Graphs widget and select the relevant charts
Note: add one or more Brand Keywords: i.e. the name of the product, service, event, brand etc that you are promoting through PR
Drag on the Summary Metrics widget and select the relevant metrics
This completes the process.
Supporting content and best practices
Explore the content below - helpful for PR teams looking to adopt and explain best practices in the context of earned media and its impact on AI responses.
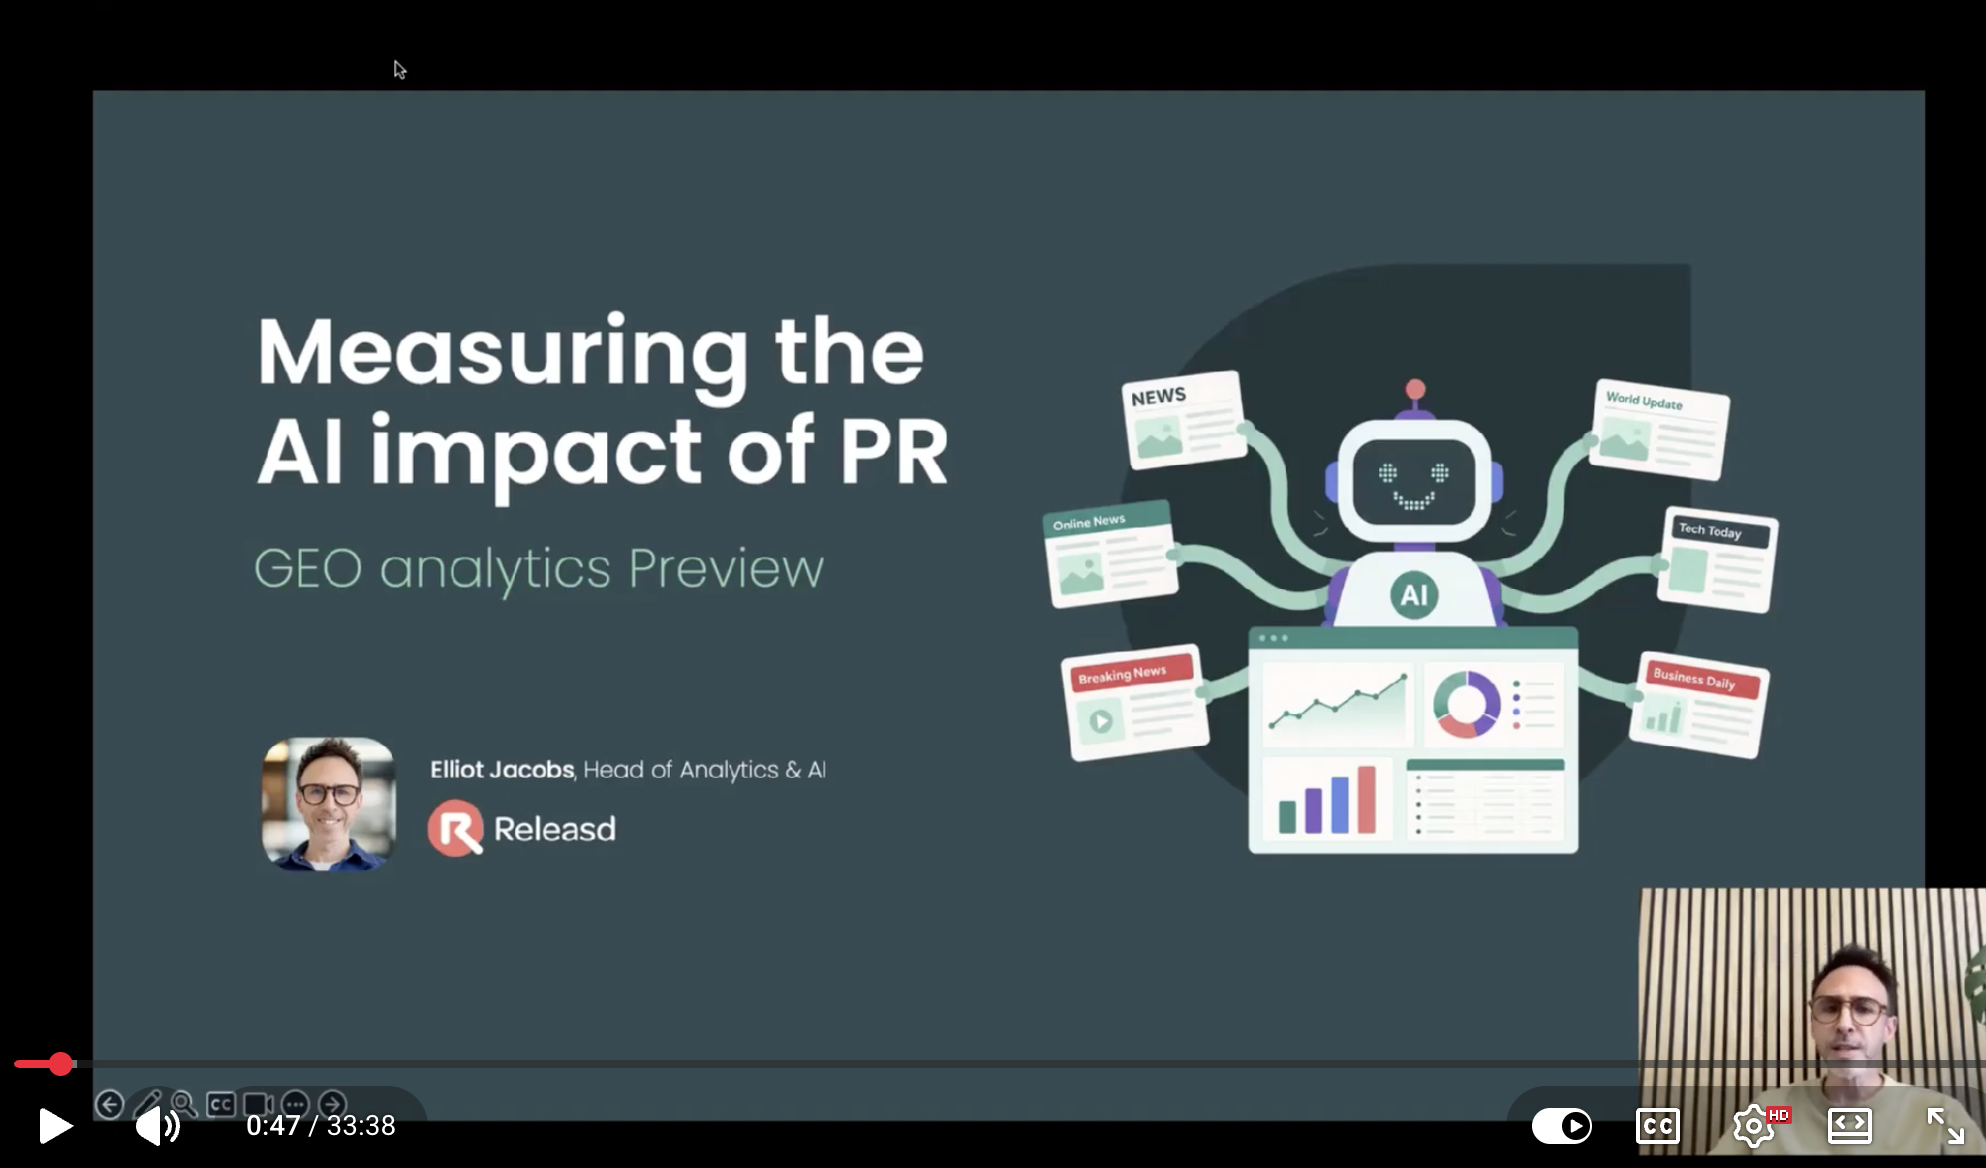
AIMS™ webinar
The AIMS™ framework, developed by Releasd, is for PR professionals looking to understand and articulate how media coverage impacts AI models.
Watch our webinar hosted by Elliot Jacobs, Head of Analytics & AI at Releasd, to learn more.
Fireside chat with Releasd's Head of Analytics & AI
Releasd CEO Richard Benson and Elliot Jacobs, Head of Analytics & AI, sat down for a wide ranging discussion on the PR industry's future in the new era of AI.
View the full fireside chat here.

See an example of Releasd's integrated earned media AI measurement.