Welcome to the Online Coverage Views by Source deep dive article. Below, we cover:
Overview & Use Cases
How we Measure Online Coverage Views by Source
How to add the Online Coverage Views by Source Chart (Evaluation Widget)
How to show total Online Coverage Views (Summary Metrics Widget)
1. Overview & Use Cases
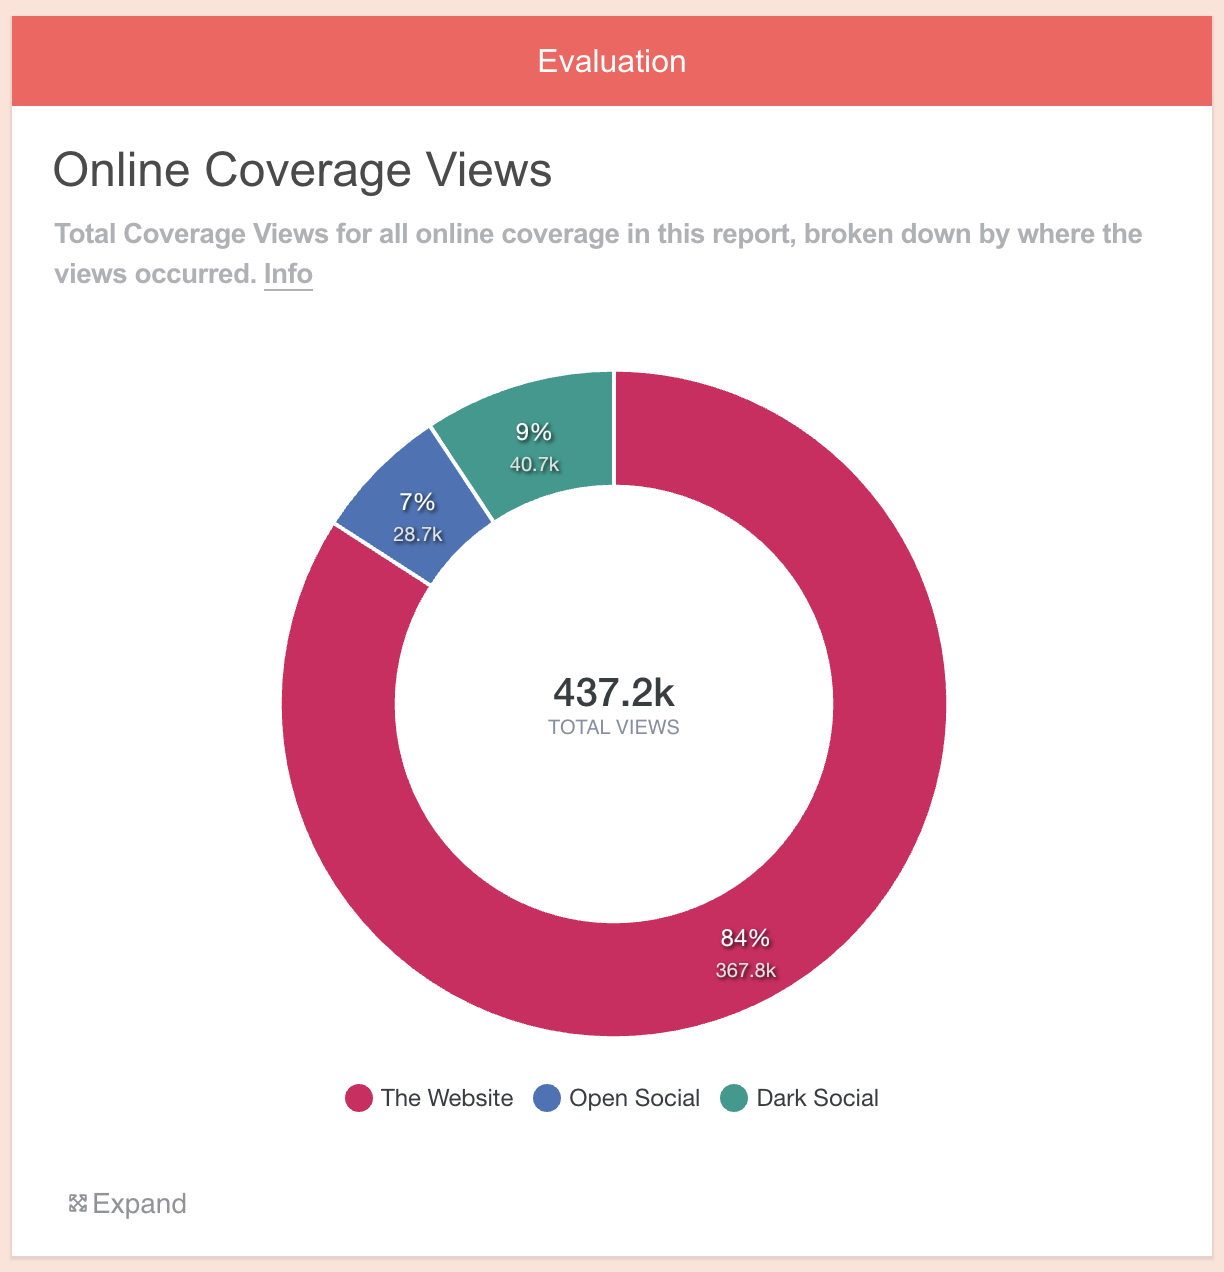
The Online Coverage Views by Source chart can be accessed via the Evaluation widget.
It combines the metrics that are displayed for individual articles in the Online Coverage widget.
The chart shows the total number of times that all online coverage within a report has been seen, broken down by the source of those views - whether on the source website, or in social media feeds if it's been shared.
Why Online Coverage Views by Source is useful:
PRs can use this chart to:
See where views have come from at a glance and show the scale of views across all platforms
Prove that online coverage is getting traction beyond the original publishing website
Make more informed decisions about story development and placement going forward
2. How we Measure Online Coverage Views by Source
When an article appears online, we are able to estimate how many views it receives ion the source website. You can read about how we estimate Online Coverage Views here.
The article can then be shared via icons on the webpage, or simply by copying/pasting the link into any other platform.
Our system can detect when this happens by:
a) querying 'open' social platforms (e.g. X, Facebook, Pinterest and Reddit) via their API
b) through our own algorithm which estimates how many views an article is receiving on dark social platforms (all other platforms, which do not have an API). Learn more about Dark Social.
When an article is shared, it will be seen by some of the sharer's followers. This chart is able to combine and display all of these views.
3. How to add an Online Coverage Views by Source Chart (Evaluation Widget)
i) First, add some Online Coverage to your report
Drag on the Online Coverage widget and enter some URLs.
You can learn how to do this here.
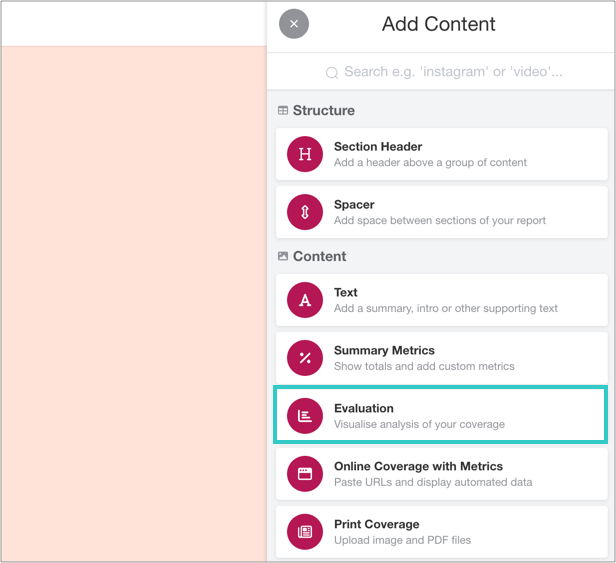
ii) Add an Evaluation widget to your report
You can find this in the Toolbar.
iii) Click 'Add Evaluation'
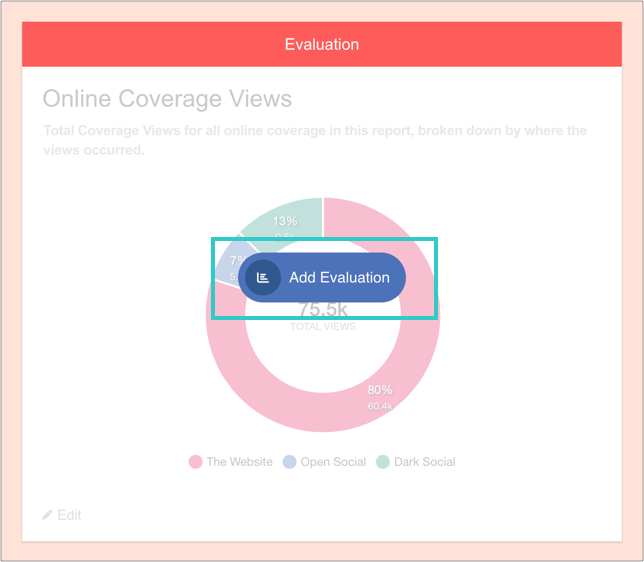
And then 'Add charts':

iv) Select the chart, and then add it to the widget
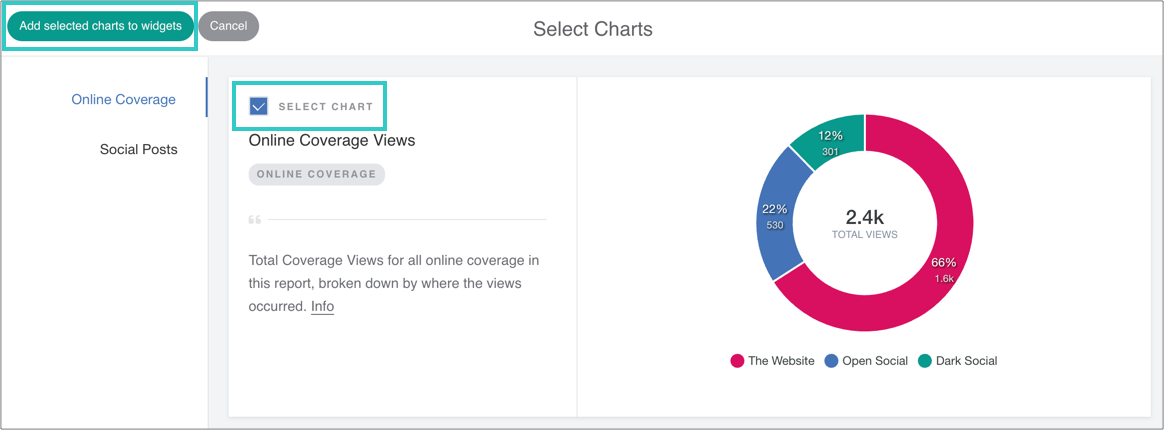
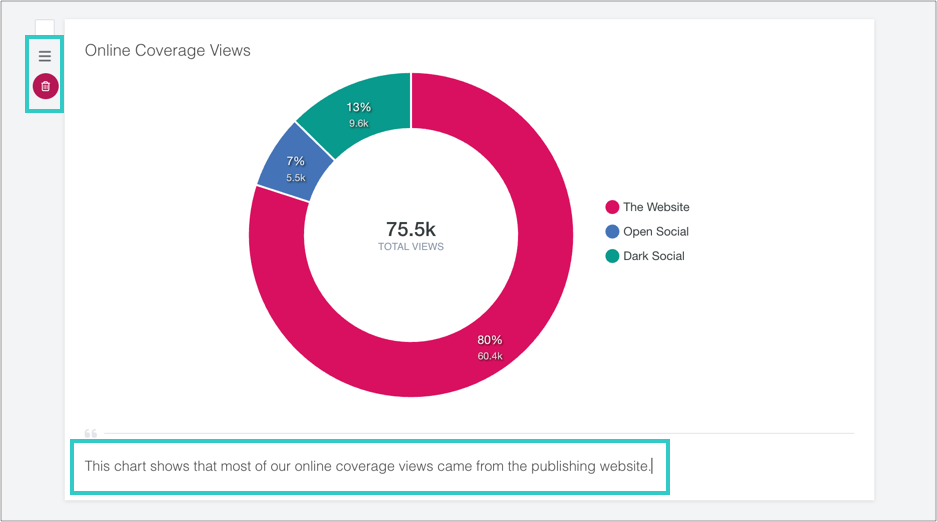
v) Optional: add a caption, reorder or delete the chart
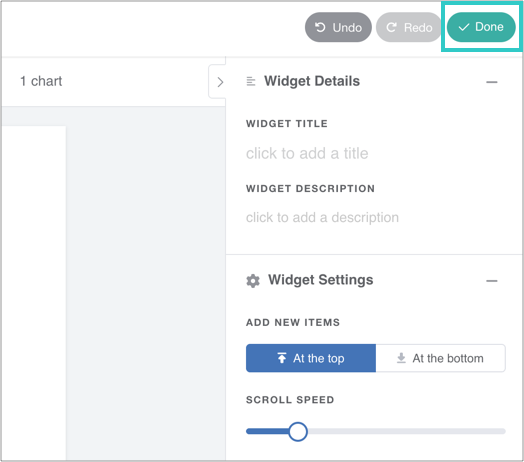
vii) Finally, click 'Done' to save the widget
The chart will automatically update as you add online coverage to the report.
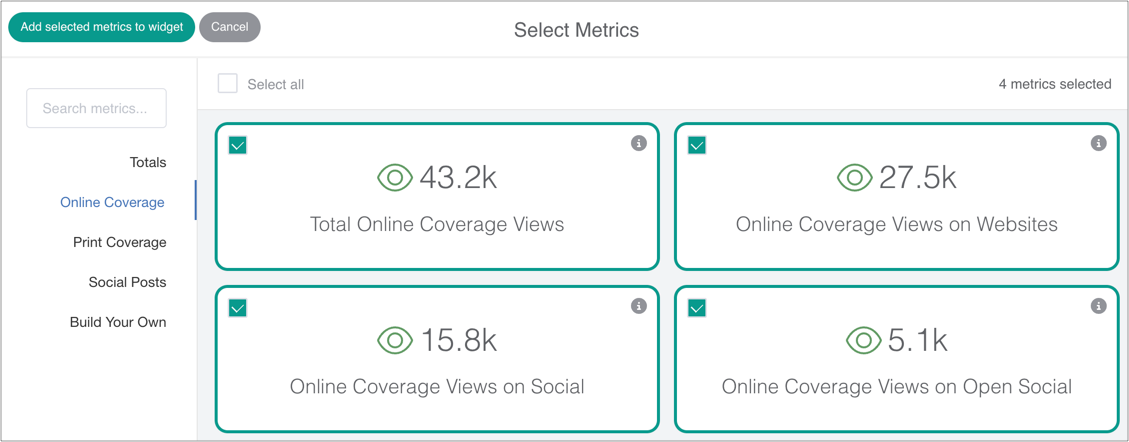
4. How to Show Total Online Coverage Views (Summary Metrics Widget)
The Summary Metrics widget totals up all individual metrics in a report.
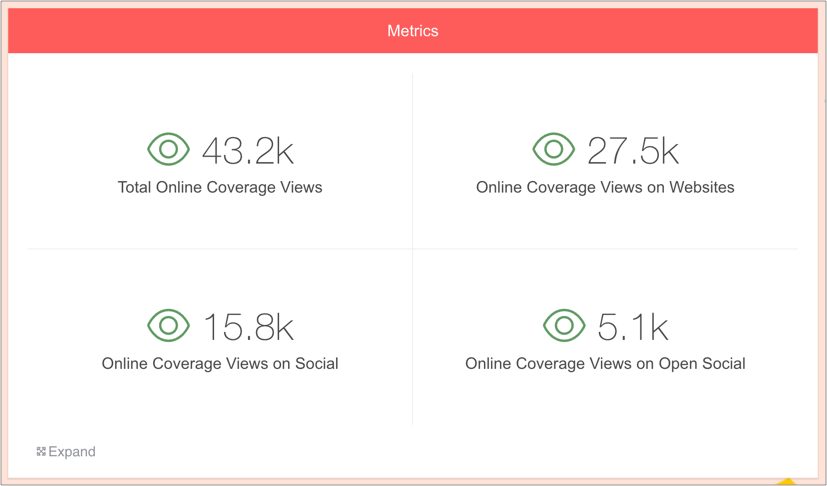
To add metrics for Online Coverage by Source, simply drag on a Summary Metrics widget, select the relevant metrics and save the widget.