Sometimes, a report may be split into sections. For example:
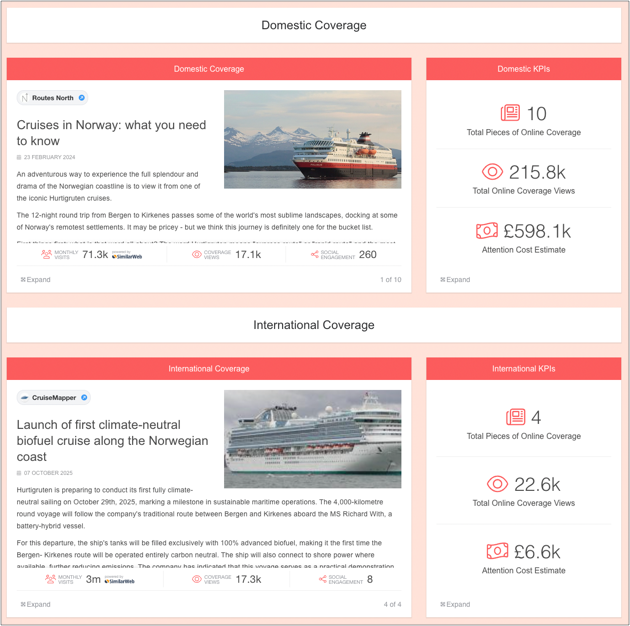
Coverage by region
Tiers (1, 2 3)
Proactive vs Reactive Coverage
Campaigns
It's easy to display measurement data for each individual section (as well as the overall report).
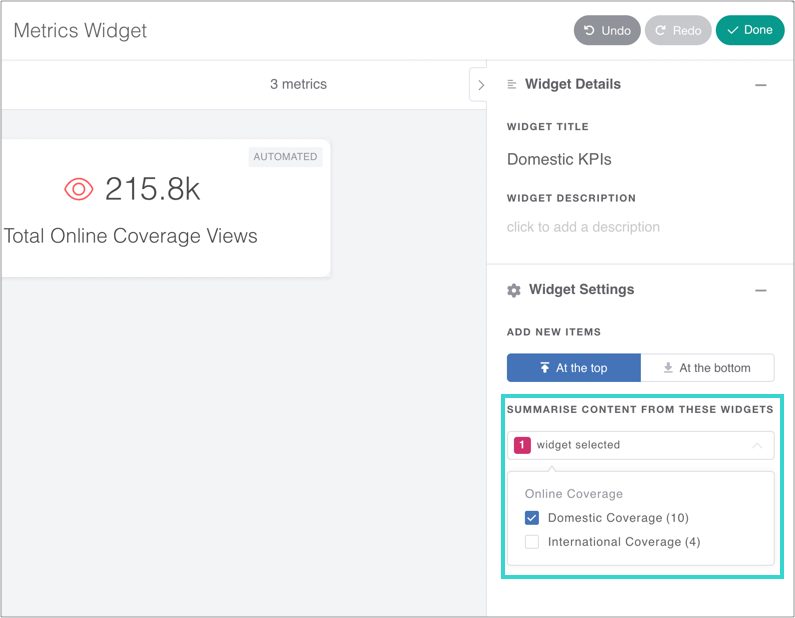
Summary Metrics Widget (for Individual KPIs)
The Summary Metrics widget displays KPIs in a visual infographic:
To show data for particular elements of the report, edit the widget and use the filter in the sidebar.
This works for Online, Social and Print coverage.
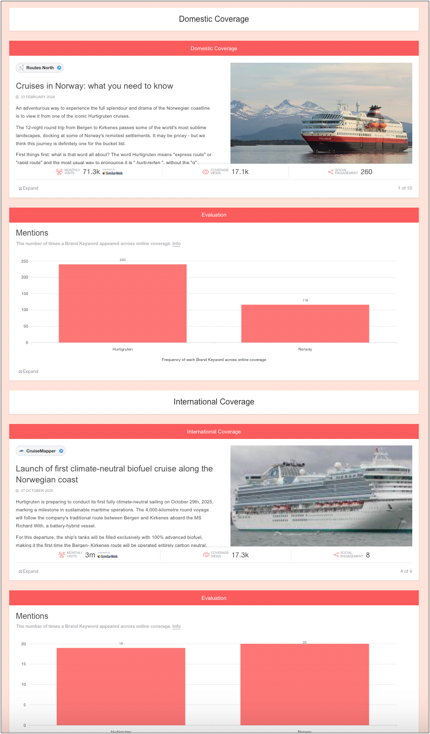
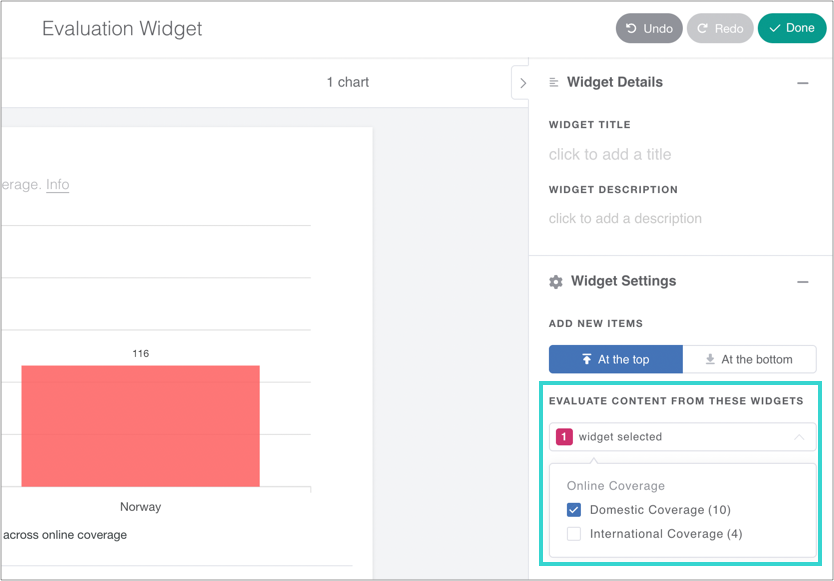
Evaluation Widget (for Charts & Graphs)
The Evaluation widget displays a range of powerful analytics in the form of charts and graphs.
To show data for particular elements of the report, edit the widget and use the filter in the sidebar.
This works for Online and Social coverage.
Top tip: be sure to give each widget a unique name so it can easily be identified in the filter.