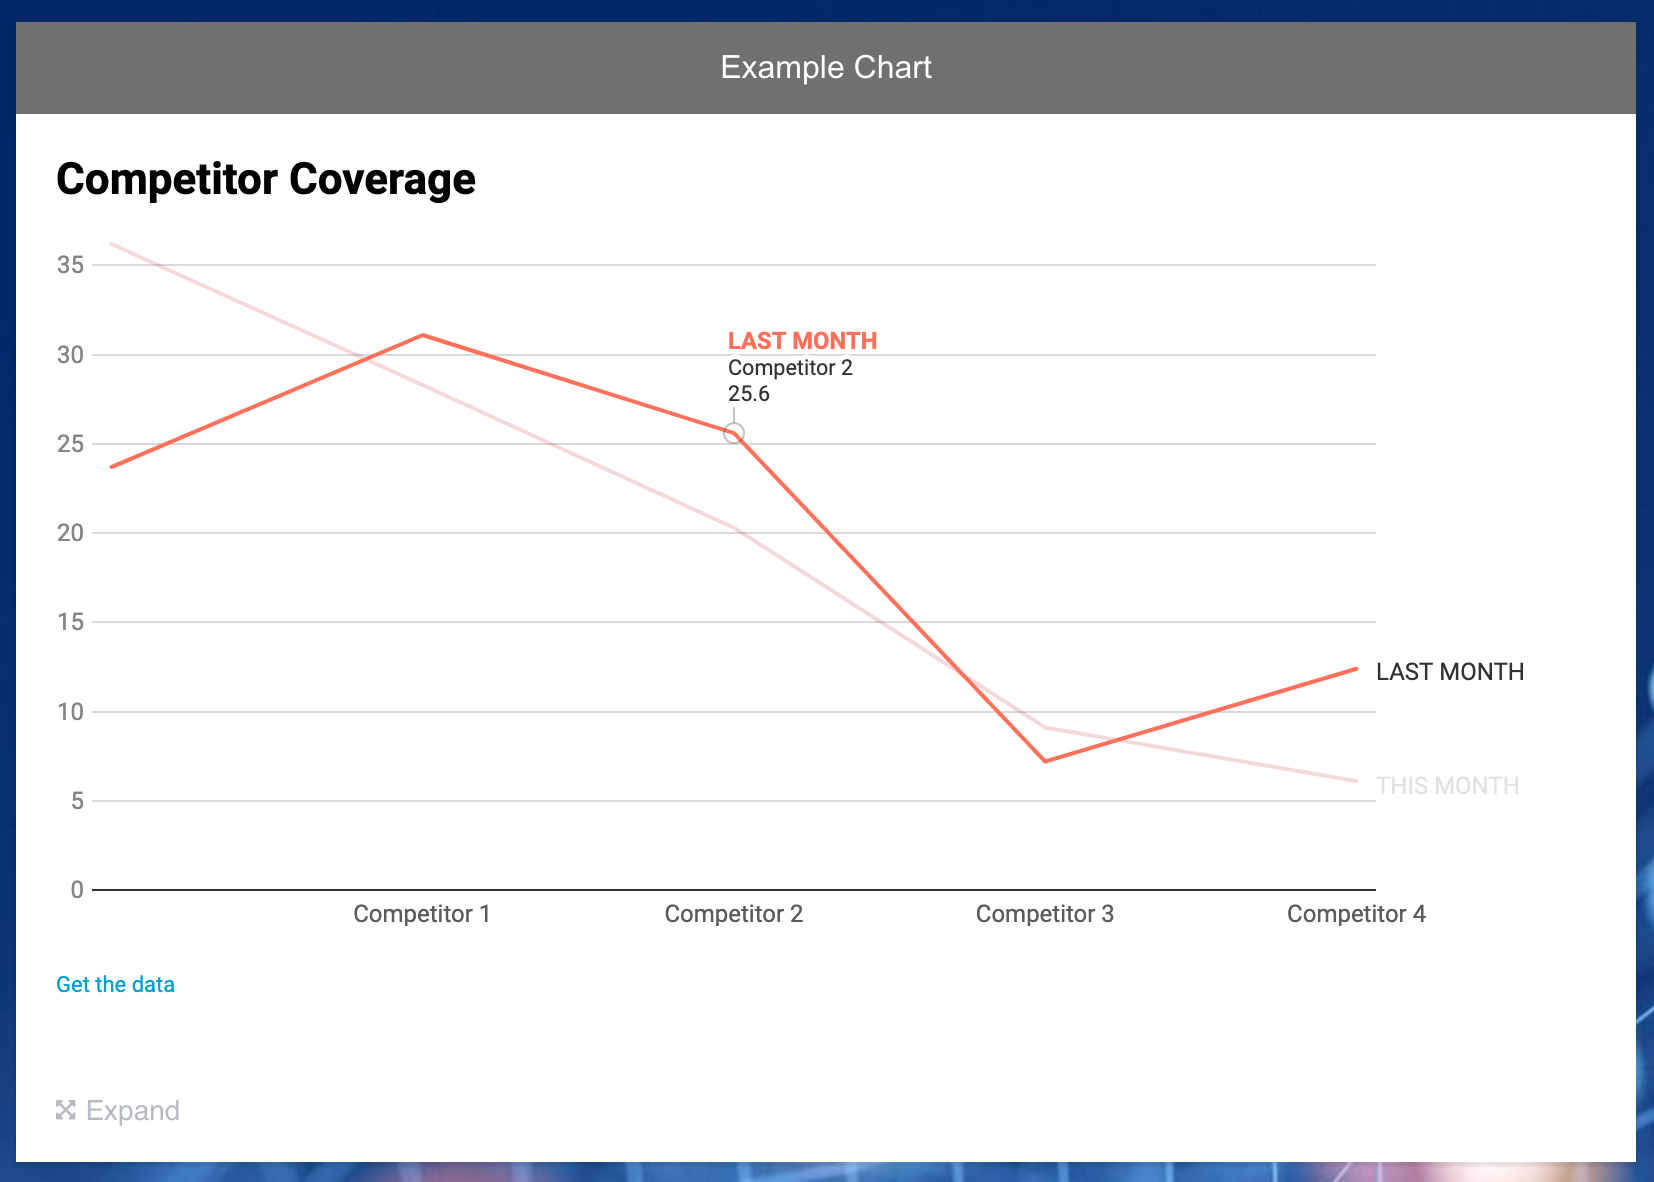
To embed a live chart or graph, you'll need to use a third party service called Datawrapper.
Users can interact with the chart, for example by hovering over it to reveal data points.
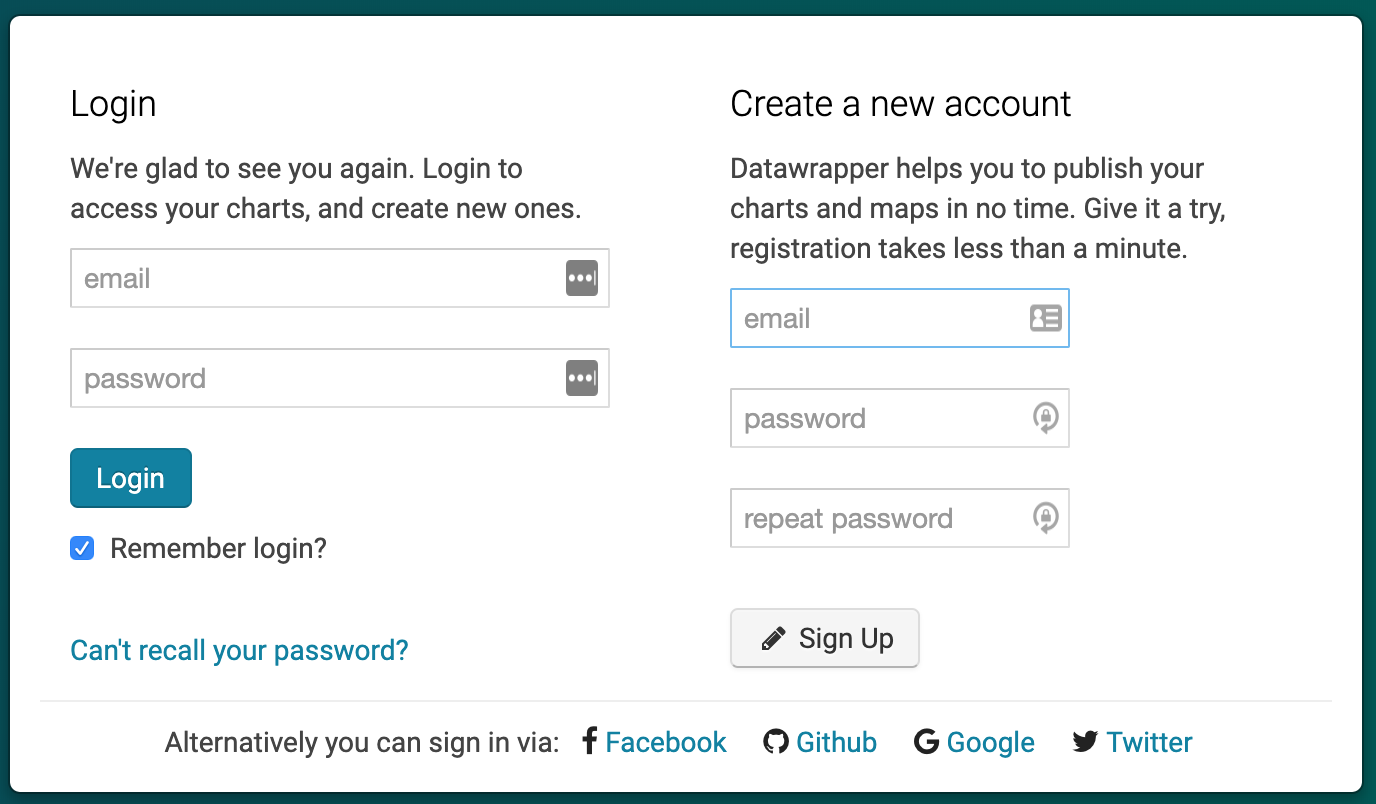
1. Sign up for a free Datawrapper account
2. Click 'New Chart' in the header
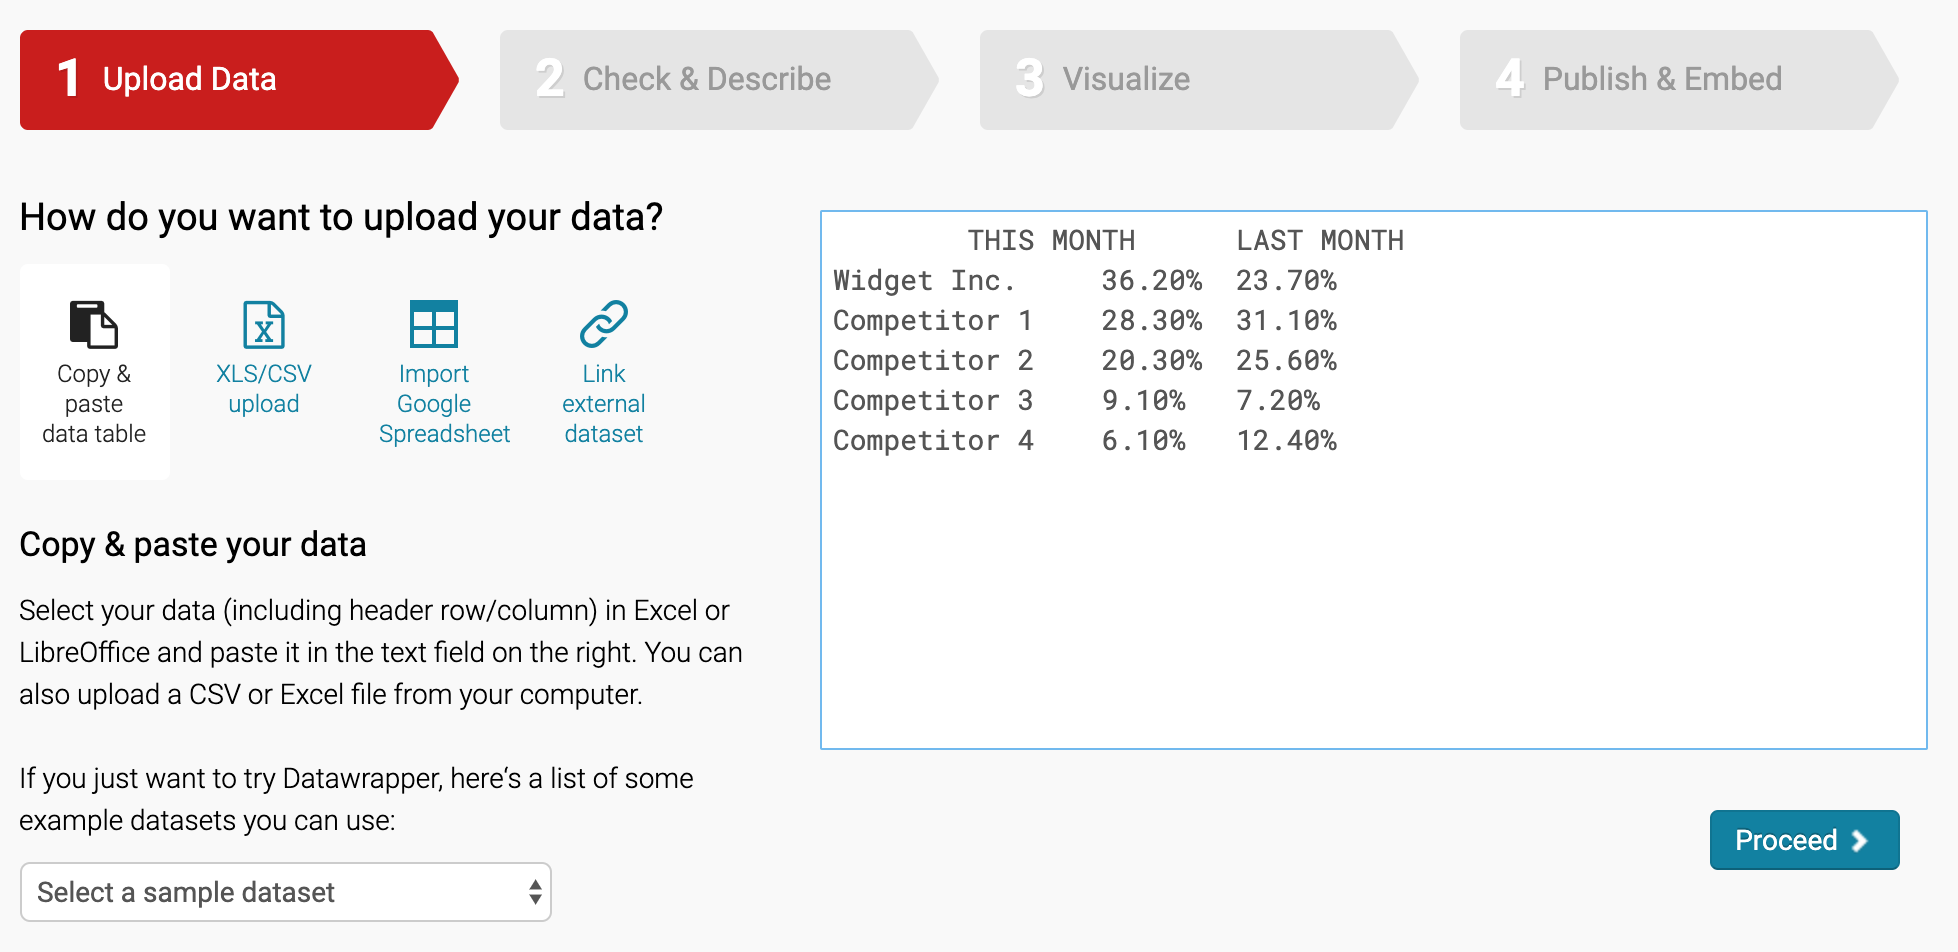
3. Add your data
You can do this via copy/paste, uploading a spreadsheet or linking to a Google Doc.
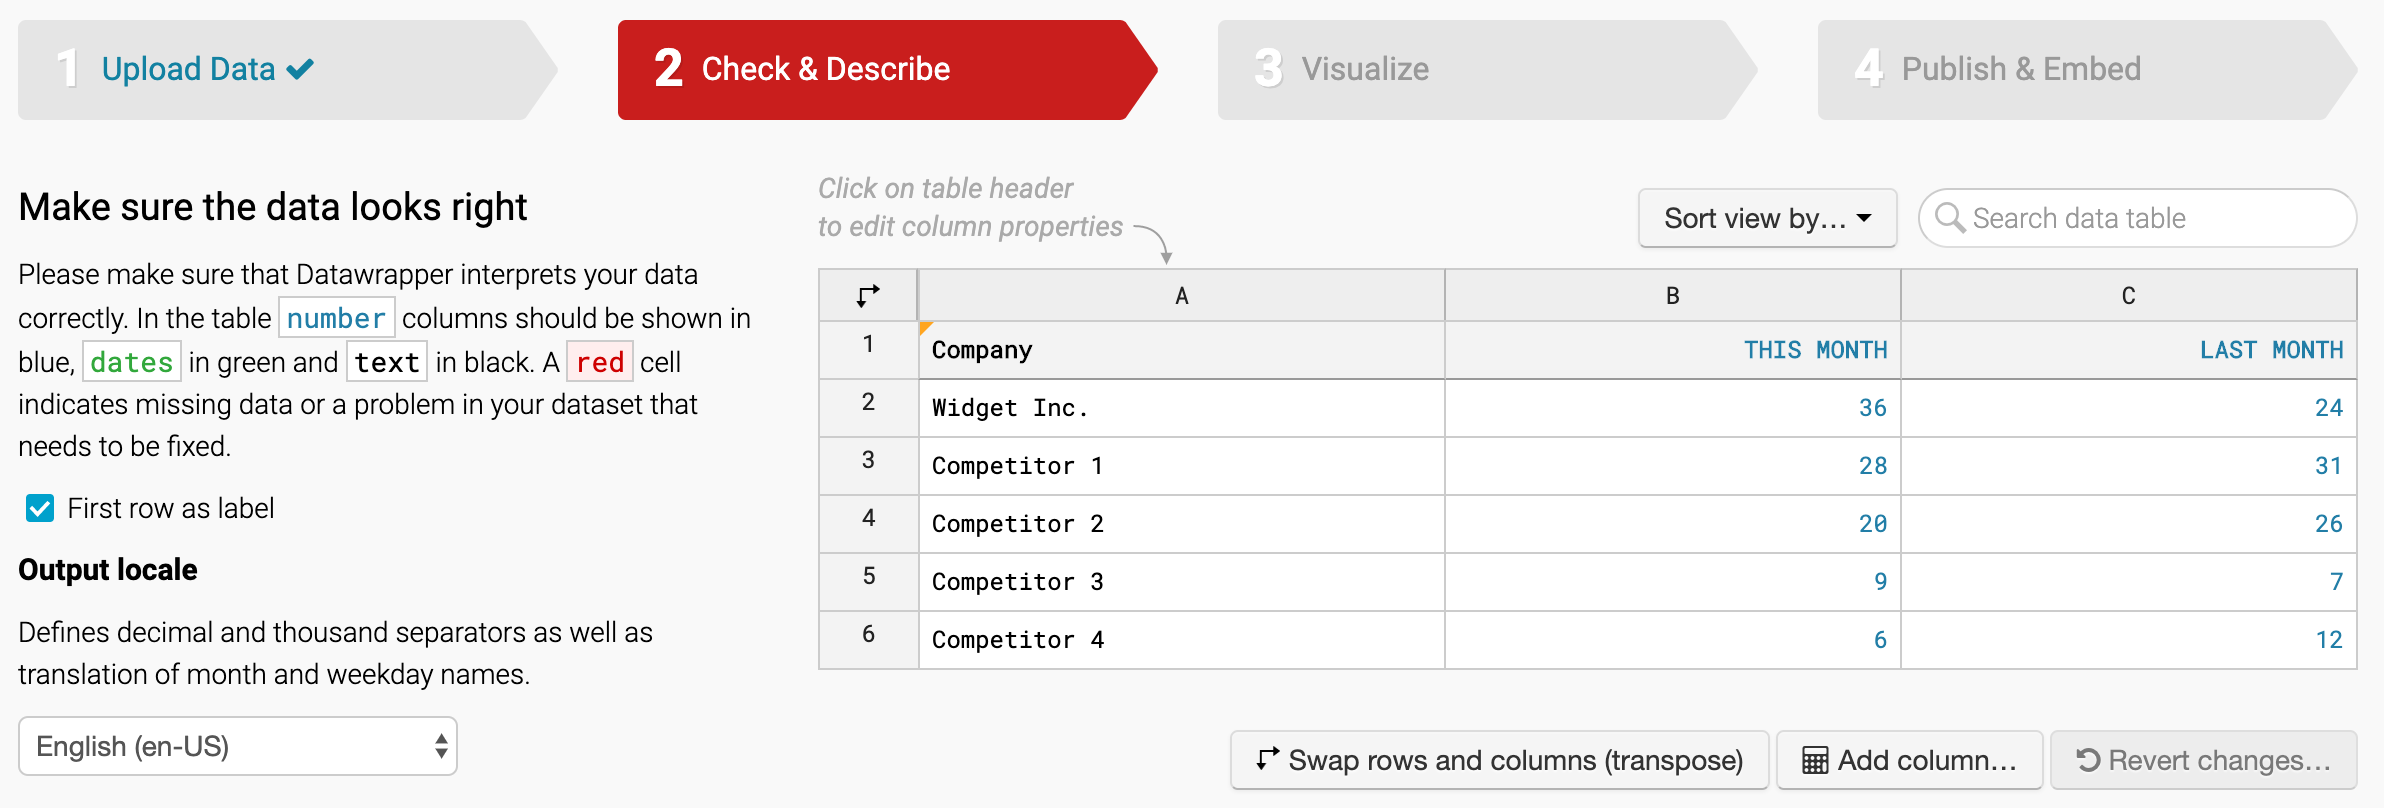
4. Check your data
You can manually overwrite content within the table by clicking on a cell.
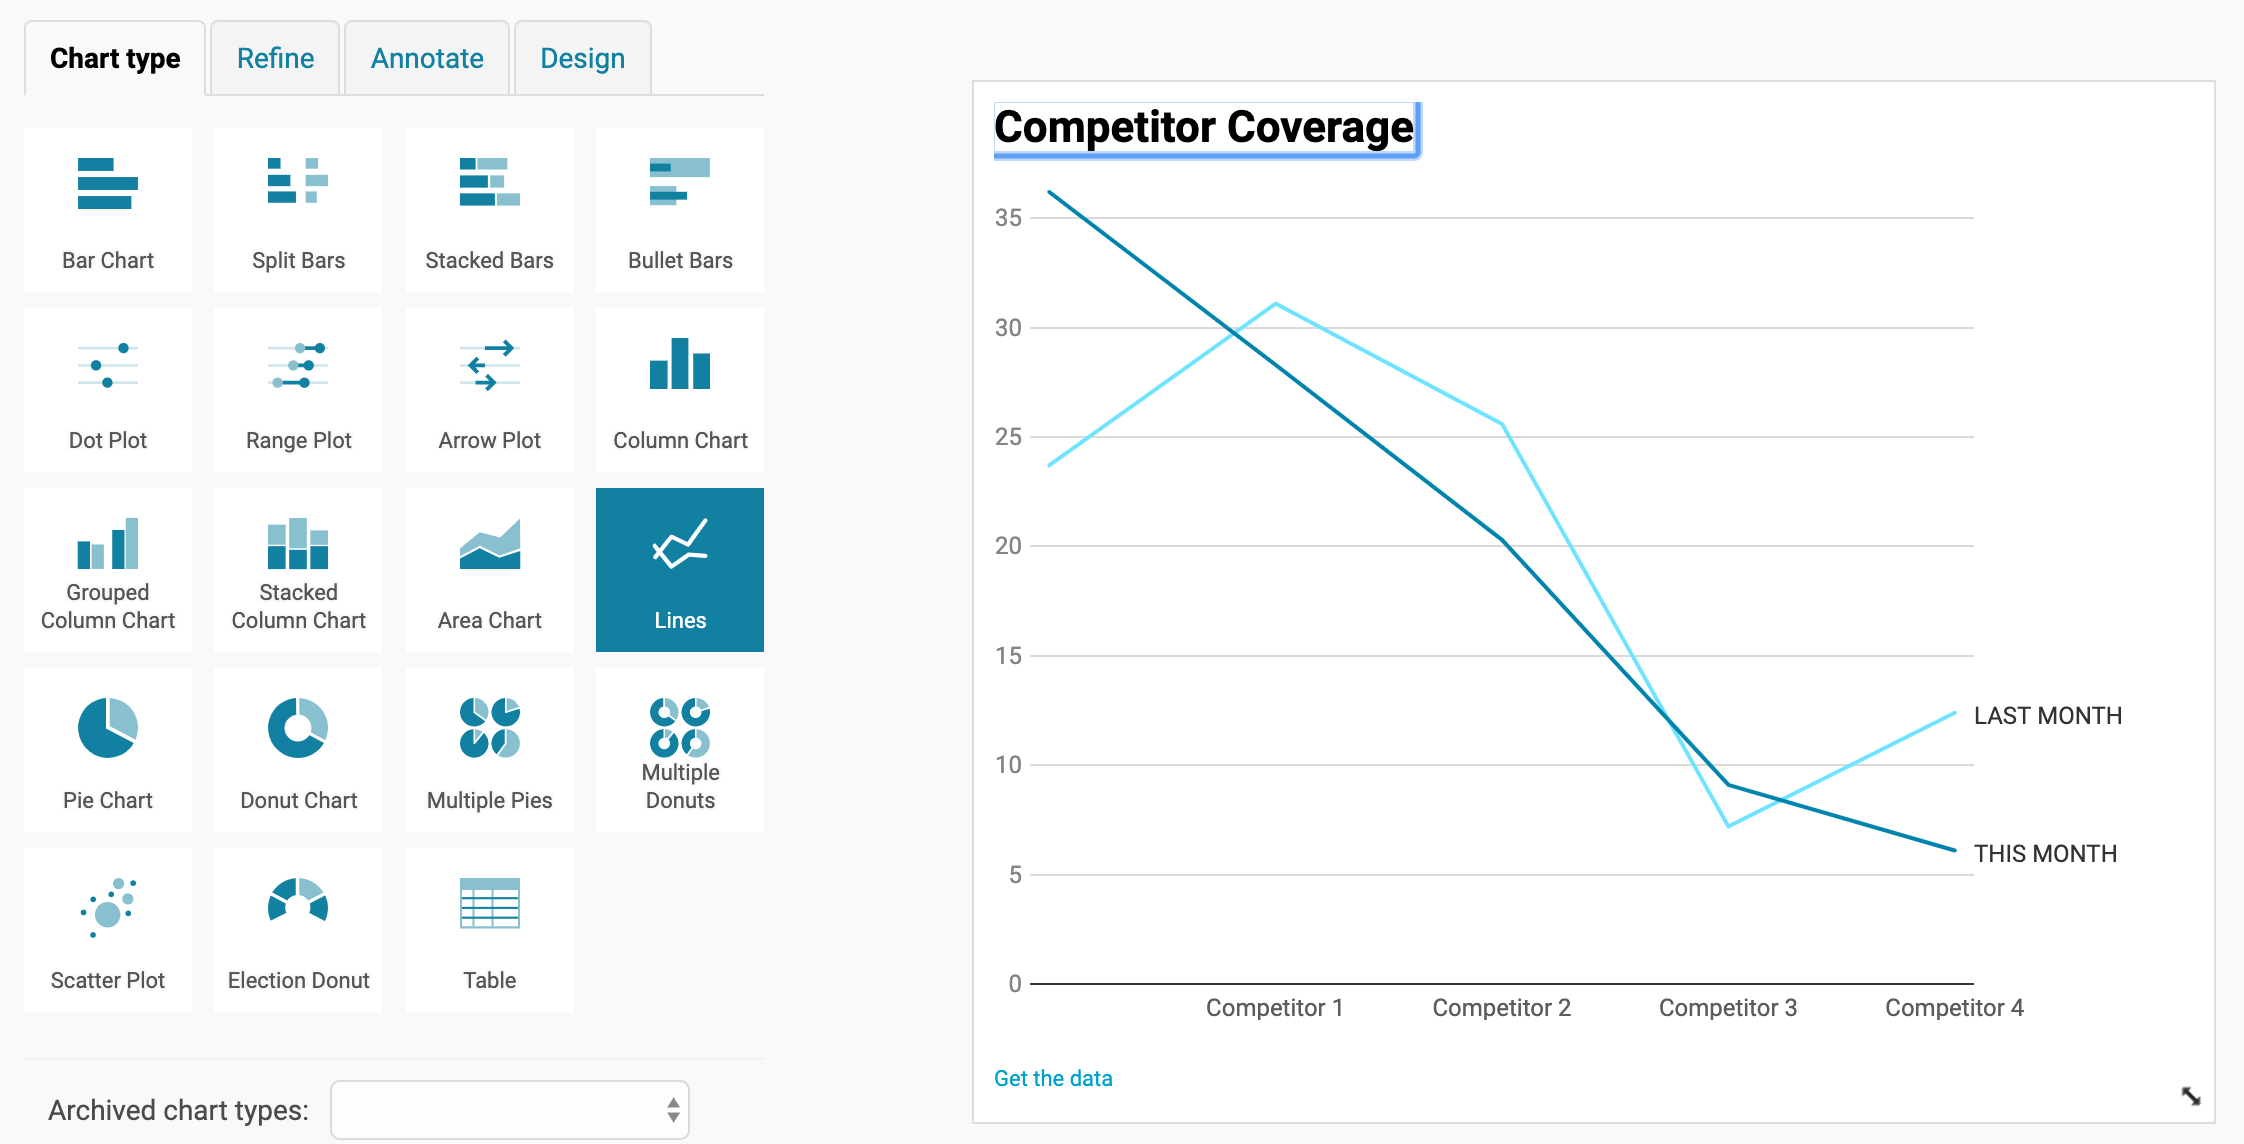
5. Select the chart type
You can also add an optional title at this point.
Tip: the Refine, Annotate and Design tabs provide further customisation options.
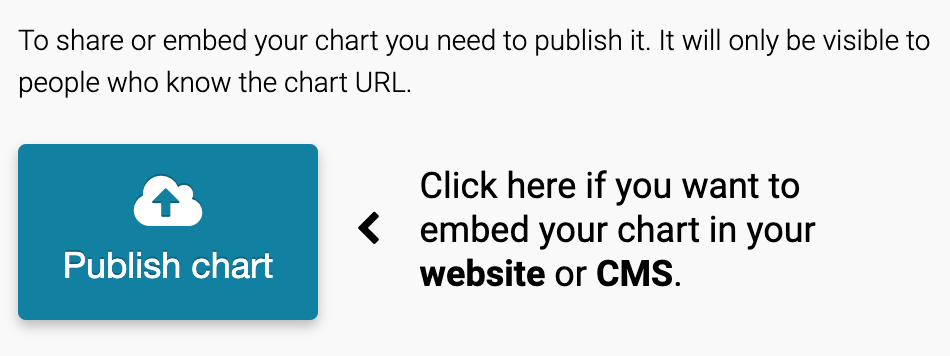
6. Click 'Publish chart'
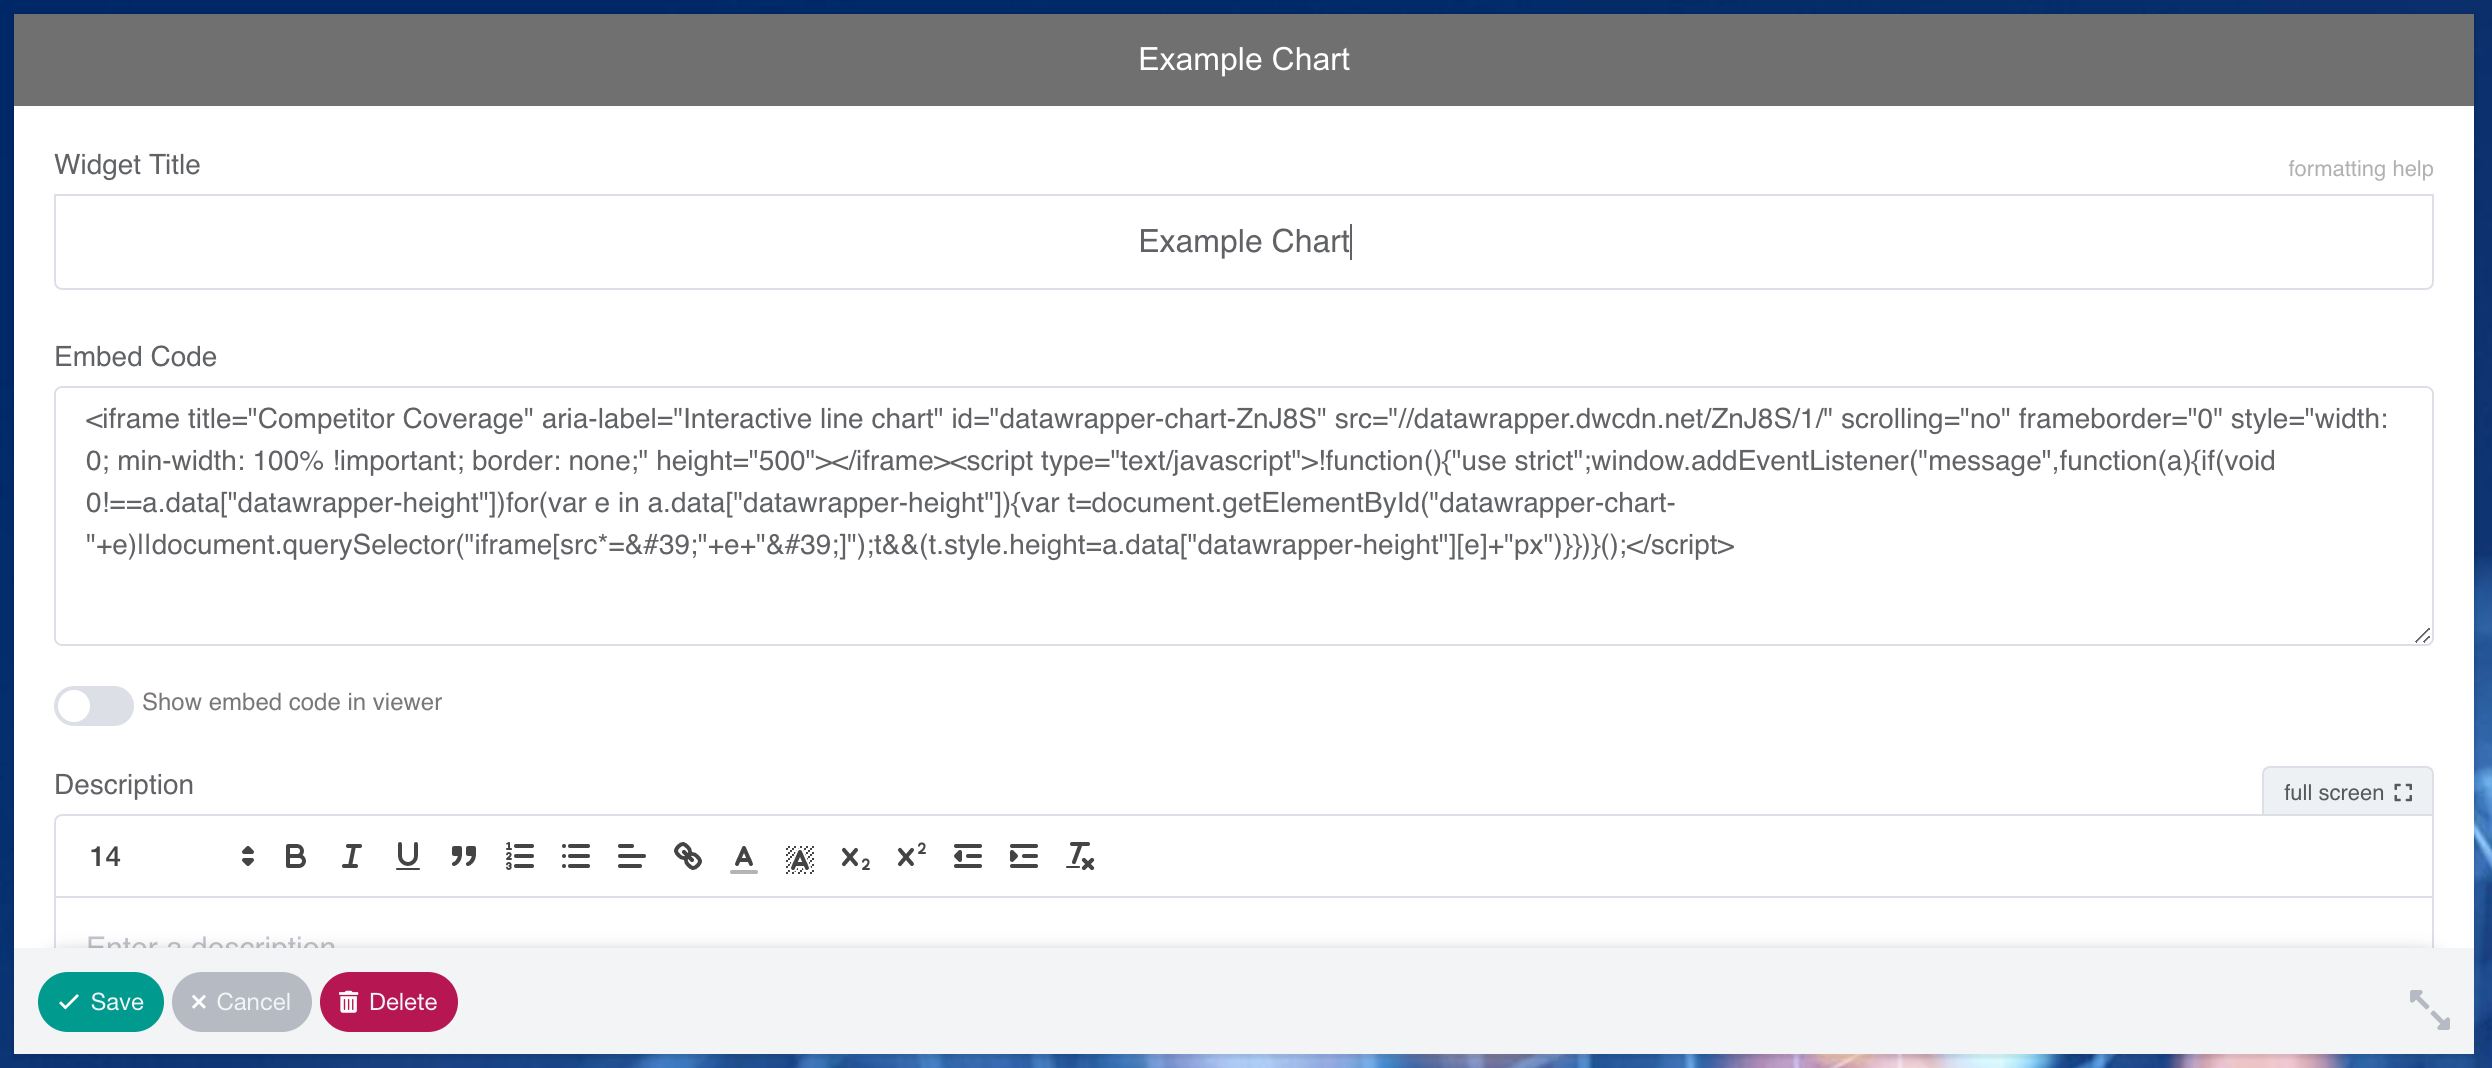
7. Copy the embed code
8. Finally, paste it into an Embed widget within Releasd

